33
/
AIzaSyAYiBZKx7MnpbEhh9jyipgxe19OcubqV5w
August 1, 2025
32755
Europe & Central Asia (IDA & IBRD countries)
TEC
false
2
1
Labor force with primary education, female (% of female labor force)
2014,2013,2012,2011,2010,2009,2008,2007,2006,2005,2004,2003
Download
Global statistics library →Europe & Central Asia (IDA & IBRD countries) →

Labor force with primary education, female (% of female labor force)

This statistics in other country:

AlbaniaAlgeriaAntigua and BarbudaArgentinaArmeniaArubaAustraliaAustriaAzerbaijanBahamas, TheBahrainBarbadosBelarusBelgiumBelizeBermudaBoliviaBosnia and HerzegovinaBotswanaBrazilBritish Virgin IslandsBulgariaCanadaCayman IslandsCentral Europe and the BalticsChadChileColombiaCosta RicaCroatiaCubaCyprusCzech RepublicDenmarkDominicaDominican RepublicEcuadorEgypt, Arab Rep.El SalvadorEstoniaEthiopiaEuro areaEurope & Central AsiaEurope & Central Asia (excluding high income)Europe & Central Asia (IDA & IBRD countries)European UnionFinlandFranceGeorgiaGermanyGhanaGreeceGuatemalaGuyanaHigh incomeHondurasHong Kong SAR, ChinaHungaryIcelandIndiaIndonesiaIran, Islamic Rep.IrelandIsraelItalyJapanJordanKazakhstanKorea, Rep.KuwaitKyrgyz RepublicLatin America & Caribbean Latin America & Caribbean (excluding high income)Latin America & the Caribbean (IDA & IBRD countries)LatviaLebanonLithuaniaLuxembourgMacao SAR, ChinaMacedonia, FYRMadagascarMalaysiaMaltaMauritiusMexicoMoldovaMongoliaMontenegroMoroccoNamibiaNepalNetherlandsNew ZealandNicaraguaNigerNigeriaNorth AmericaNorwayOECD membersOmanPakistanPanamaParaguayPeruPhilippinesPolandPortugalPost-demographic dividendRomaniaRussian FederationRwandaSan MarinoSaudi ArabiaSerbiaSingaporeSlovak RepublicSloveniaSouth AfricaSouth AsiaSouth Asia (IDA & IBRD)SpainSri LankaSt. Kitts and NevisSt. LuciaSt. Vincent and the GrenadinesSwedenSwitzerlandSyrian Arab RepublicTajikistanThailandTimor-LesteTrinidad and TobagoTunisiaTurkeyUgandaUkraineUnited Arab EmiratesUnited KingdomUnited StatesUruguayVenezuela, RBWest Bank and GazaYemen, Rep.

Timeline:

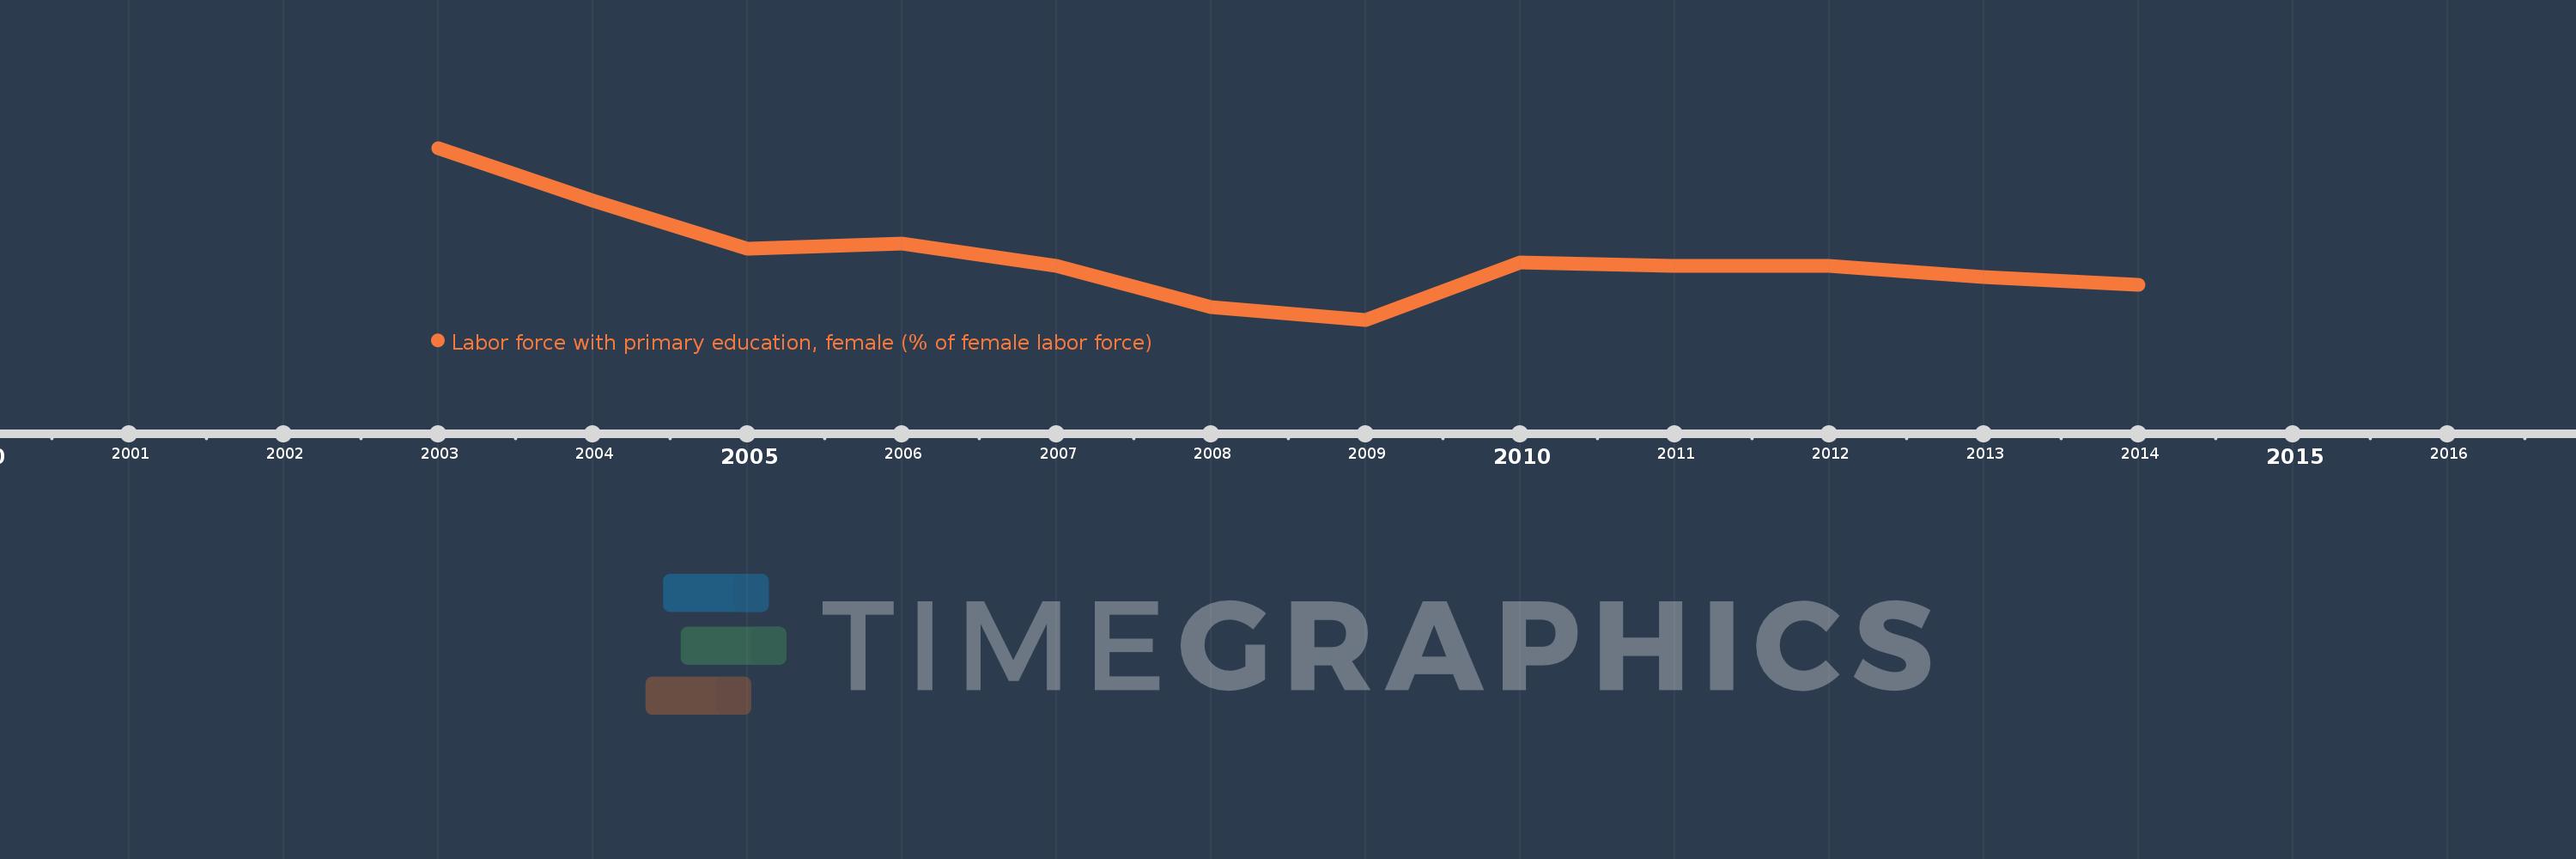
This timeline shows a graph from 2003 to 2014 of Europe & Central Asia (IDA & IBRD countries). No data until 2002. Number of actual observations by date: 12.

Source name:

World Development Indicators

Source organization:

International Labour Organization, Key Indicators of the Labour Market database.

Categories, topics:

Education, Social Protection & Labor, Gender

Last updated:

apr 23, 2017

Indicators value changes by year

Meaning:
13.261
Minimum:
11.306
jan 1, 2009
Maximum:
16.706
jan 1, 2003
At the date of observation
Value
Absolute change
Change from the previous value
jan 1, 2003
16.706
+16.706
0.0%
jan 1, 2004
15.05
-1.656
-9.91%
jan 1, 2005
13.533
-1.517
-10.08%
jan 1, 2006
13.7
+0.167
1.23%
jan 1, 2007
13.005
-0.695
-5.07%
jan 1, 2008
11.694
-1.312
-10.09%
jan 1, 2009
11.306
-0.387
-3.31%
jan 1, 2010
13.105
+1.798
15.91%
jan 1, 2011
12.996
-0.109
-0.83%
jan 1, 2012
13.002
+0.007
0.05%
jan 1, 2013
12.64
-0.362
-2.79%
jan 1, 2014
12.398
-0.242
-1.91%

Ranking of countries by current statistics by years