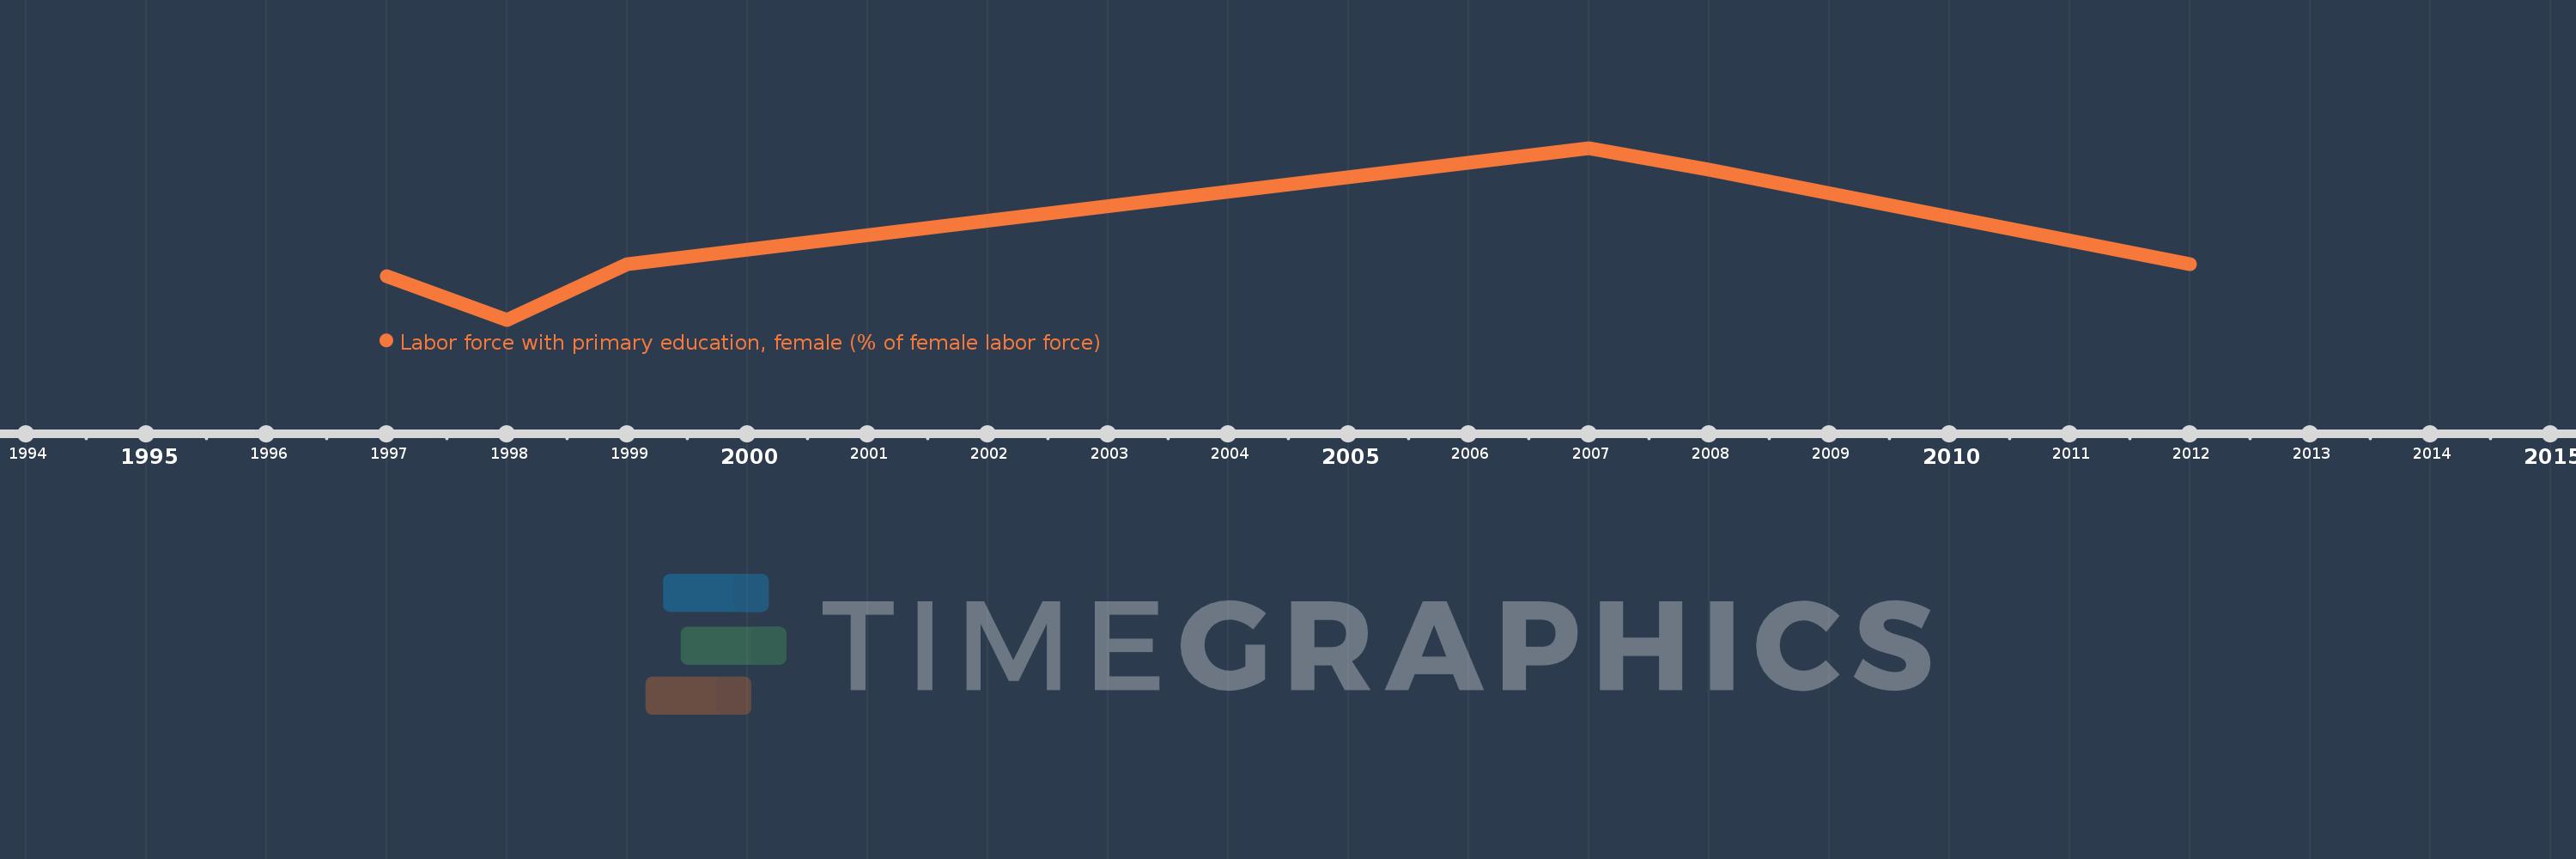
This timeline shows a graph from 1997 to 2012 of Latin America & Caribbean (excluding high income). No data until 1996. Number of actual observations by date: 6.
Source name:
World Development Indicators
Source organization:
International Labour Organization, Key Indicators of the Labour Market database.
Categories, topics:
Education, Social Protection & Labor, Gender
Last updated:
apr 23, 2017
Indicators value changes by year
Meaning:
31.726
Minimum:
24.0
jan 1, 1998
Maximum:
40.678
jan 1, 2007
At the date of observation
Value
Absolute change
Change from the previous value
jan 1, 1997
28.258
+28.258
0.0%
jan 1, 1998
24.0
-4.258
-15.07%
jan 1, 1999
29.409
+5.409
22.54%
jan 1, 2007
40.678
+11.269
38.32%
jan 1, 2008
38.598
-2.08
-5.11%
jan 1, 2012
29.415
-9.183
-23.79%
Ranking of countries by current statistics by years