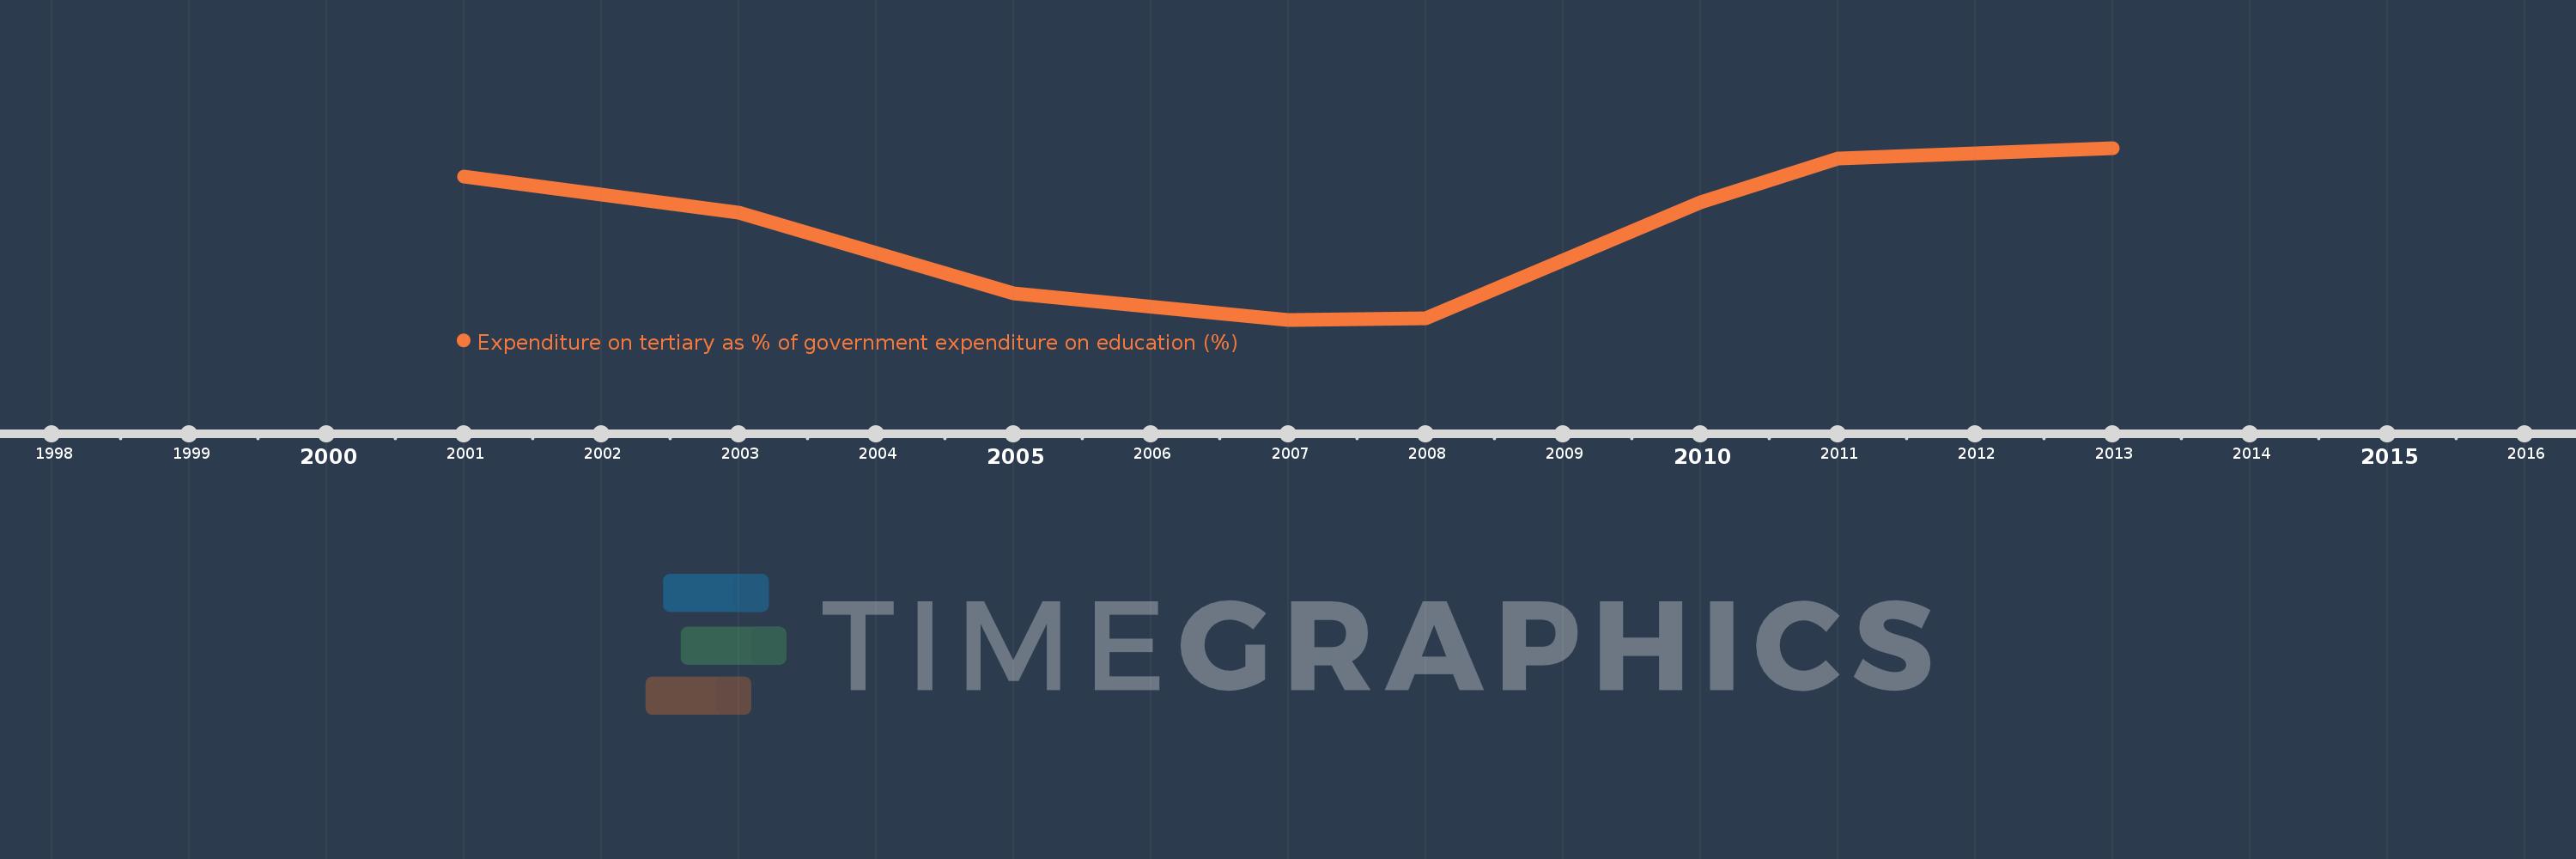
This timeline shows a graph from 2001 to 2013 of Latin America & the Caribbean (IDA & IBRD countries). No data until 2000. Number of actual observations by date: 9.
Source name:
World Development Indicators
Source organization:
UNESCO Institute for Statistics
Categories, topics:
Education
Last updated:
apr 23, 2017
Indicators value changes by year
Meaning:
18.674
Minimum:
16.932
jan 1, 2007
Maximum:
19.941
jan 1, 2013
At the date of observation
Value
Absolute change
Change from the previous value
jan 1, 2001
19.438
+19.438
0.0%
jan 1, 2003
18.815
-0.623
-3.2%
jan 1, 2005
17.394
-1.42
-7.55%
jan 1, 2007
16.932
-0.463
-2.66%
jan 1, 2008
16.961
+0.029
0.17%
jan 1, 2010
18.986
+2.026
11.94%
jan 1, 2011
19.761
+0.774
4.08%
jan 1, 2012
19.84
+0.08
0.4%
jan 1, 2013
19.941
+0.1
0.51%
Ranking of countries by current statistics by years