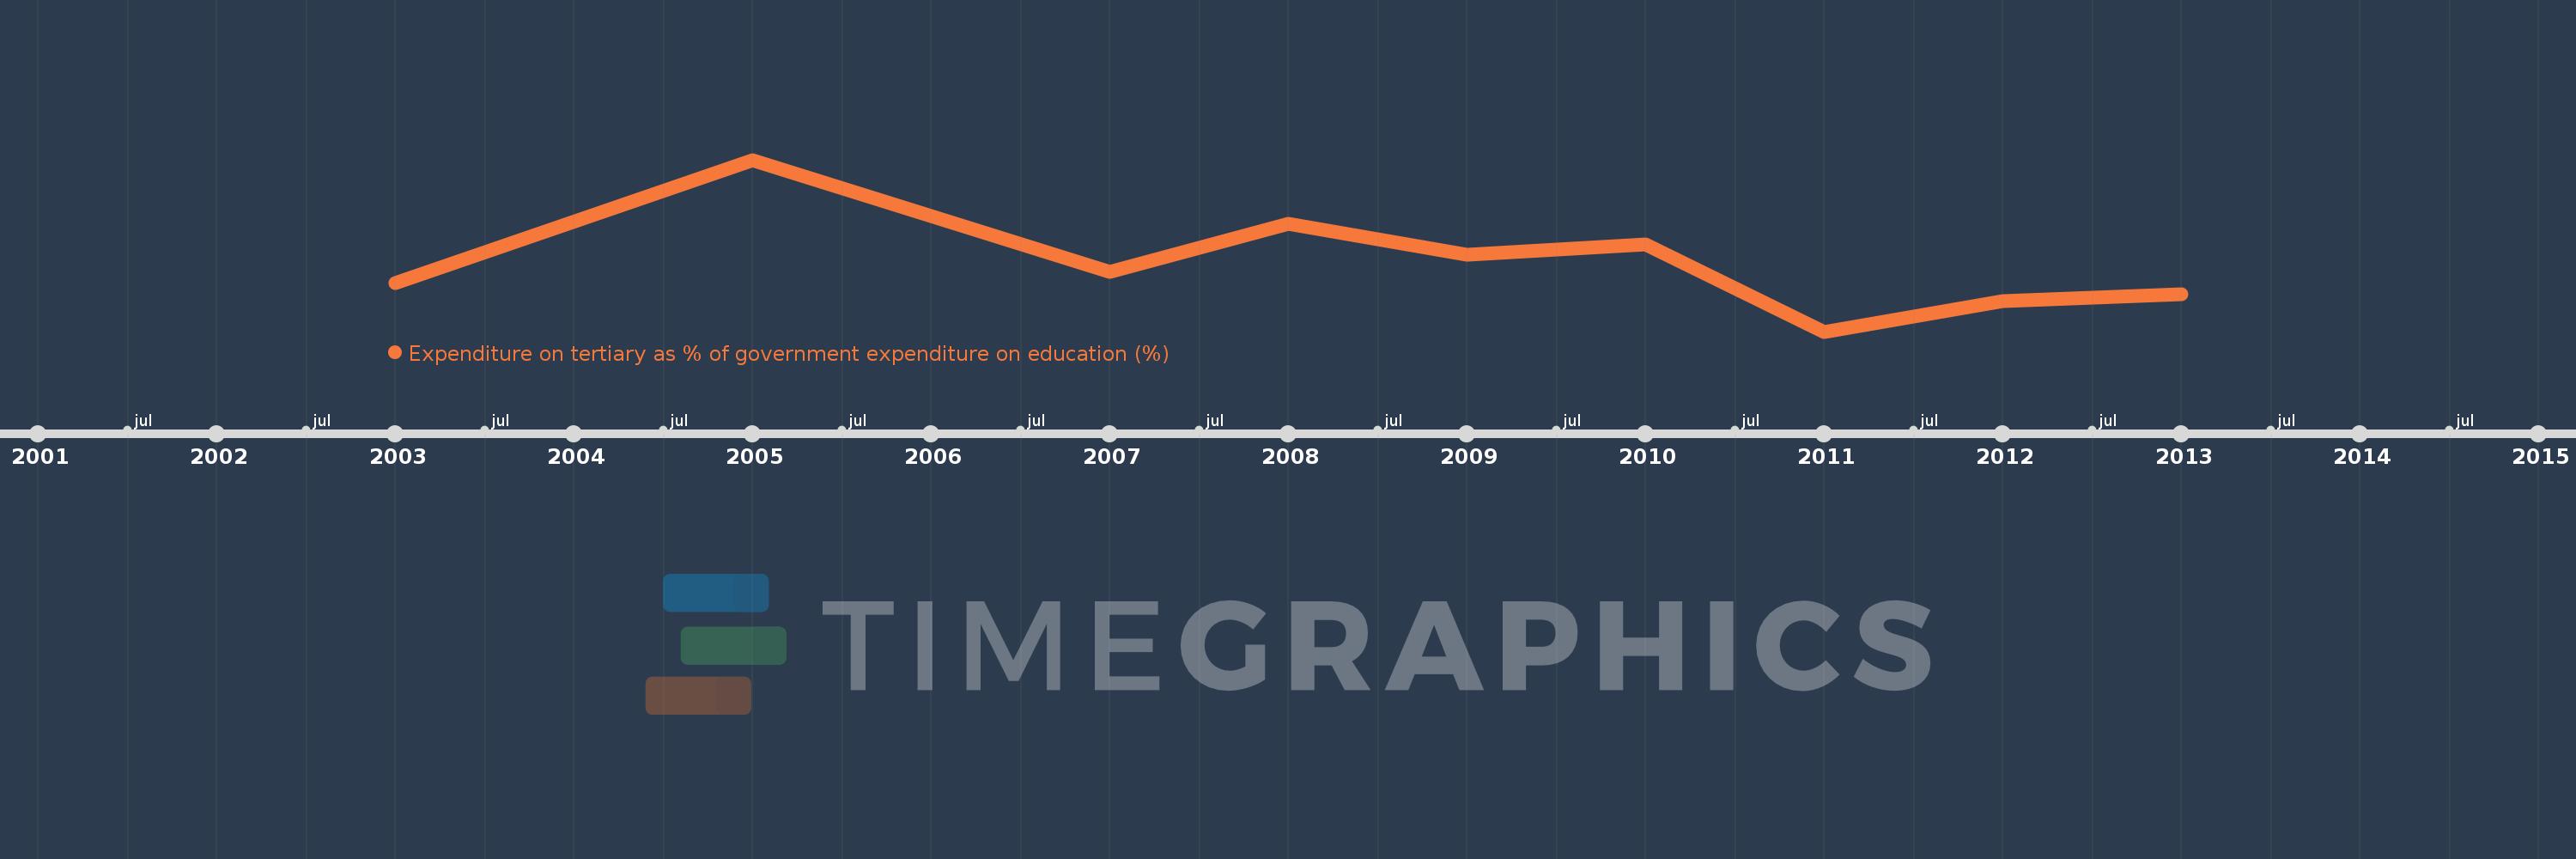
This timeline shows a graph from 2003 to 2013 of Europe & Central Asia (IDA & IBRD countries). No data until 2002. Number of actual observations by date: 9.
Source name:
World Development Indicators
Source organization:
UNESCO Institute for Statistics
Categories, topics:
Education
Last updated:
apr 23, 2017
Indicators value changes by year
Meaning:
18.49
Minimum:
17.128
jan 1, 2011
Maximum:
20.524
jan 1, 2005
At the date of observation
Value
Absolute change
Change from the previous value
jan 1, 2003
18.085
+18.085
0.0%
jan 1, 2005
20.524
+2.439
13.49%
jan 1, 2007
18.305
-2.219
-10.81%
jan 1, 2008
19.26
+0.954
5.21%
jan 1, 2009
18.645
-0.614
-3.19%
jan 1, 2010
18.851
+0.205
1.1%
jan 1, 2011
17.128
-1.723
-9.14%
jan 1, 2012
17.735
+0.608
3.55%
jan 1, 2013
17.873
+0.138
0.78%
Ranking of countries by current statistics by years