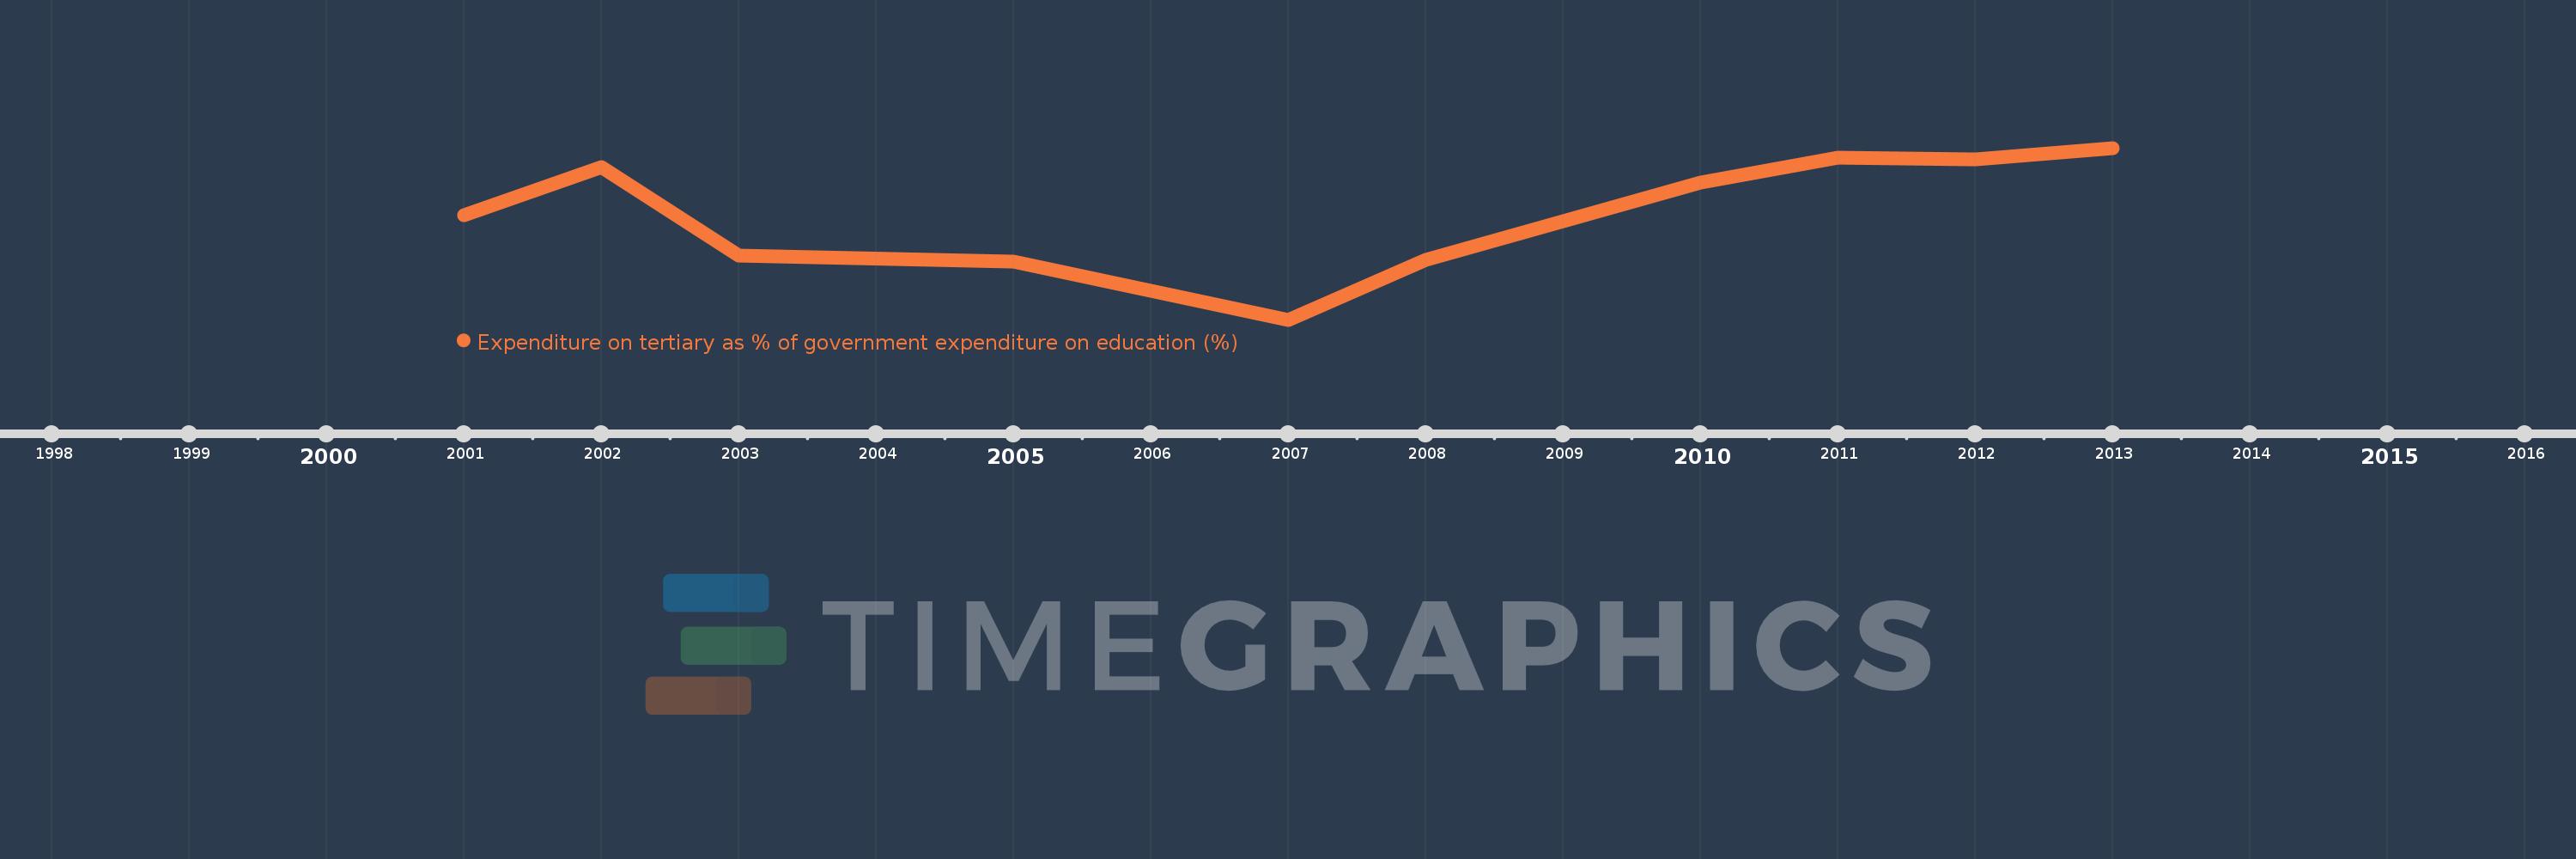
This timeline shows a graph from 2001 to 2013 of Latin America & Caribbean (excluding high income). No data until 2000. Number of actual observations by date: 10.
Source name:
World Development Indicators
Source organization:
UNESCO Institute for Statistics
Categories, topics:
Education
Last updated:
apr 23, 2017
Indicators value changes by year
Meaning:
18.828
Minimum:
17.199
jan 1, 2007
Maximum:
19.814
jan 1, 2013
At the date of observation
Value
Absolute change
Change from the previous value
jan 1, 2001
18.786
+18.786
0.0%
jan 1, 2002
19.516
+0.729
3.88%
jan 1, 2003
18.177
-1.339
-6.86%
jan 1, 2005
18.085
-0.091
-0.5%
jan 1, 2007
17.199
-0.886
-4.9%
jan 1, 2008
18.112
+0.913
5.31%
jan 1, 2010
19.29
+1.178
6.5%
jan 1, 2011
19.663
+0.373
1.94%
jan 1, 2012
19.638
-0.025
-0.13%
jan 1, 2013
19.814
+0.176
0.9%
Ranking of countries by current statistics by years