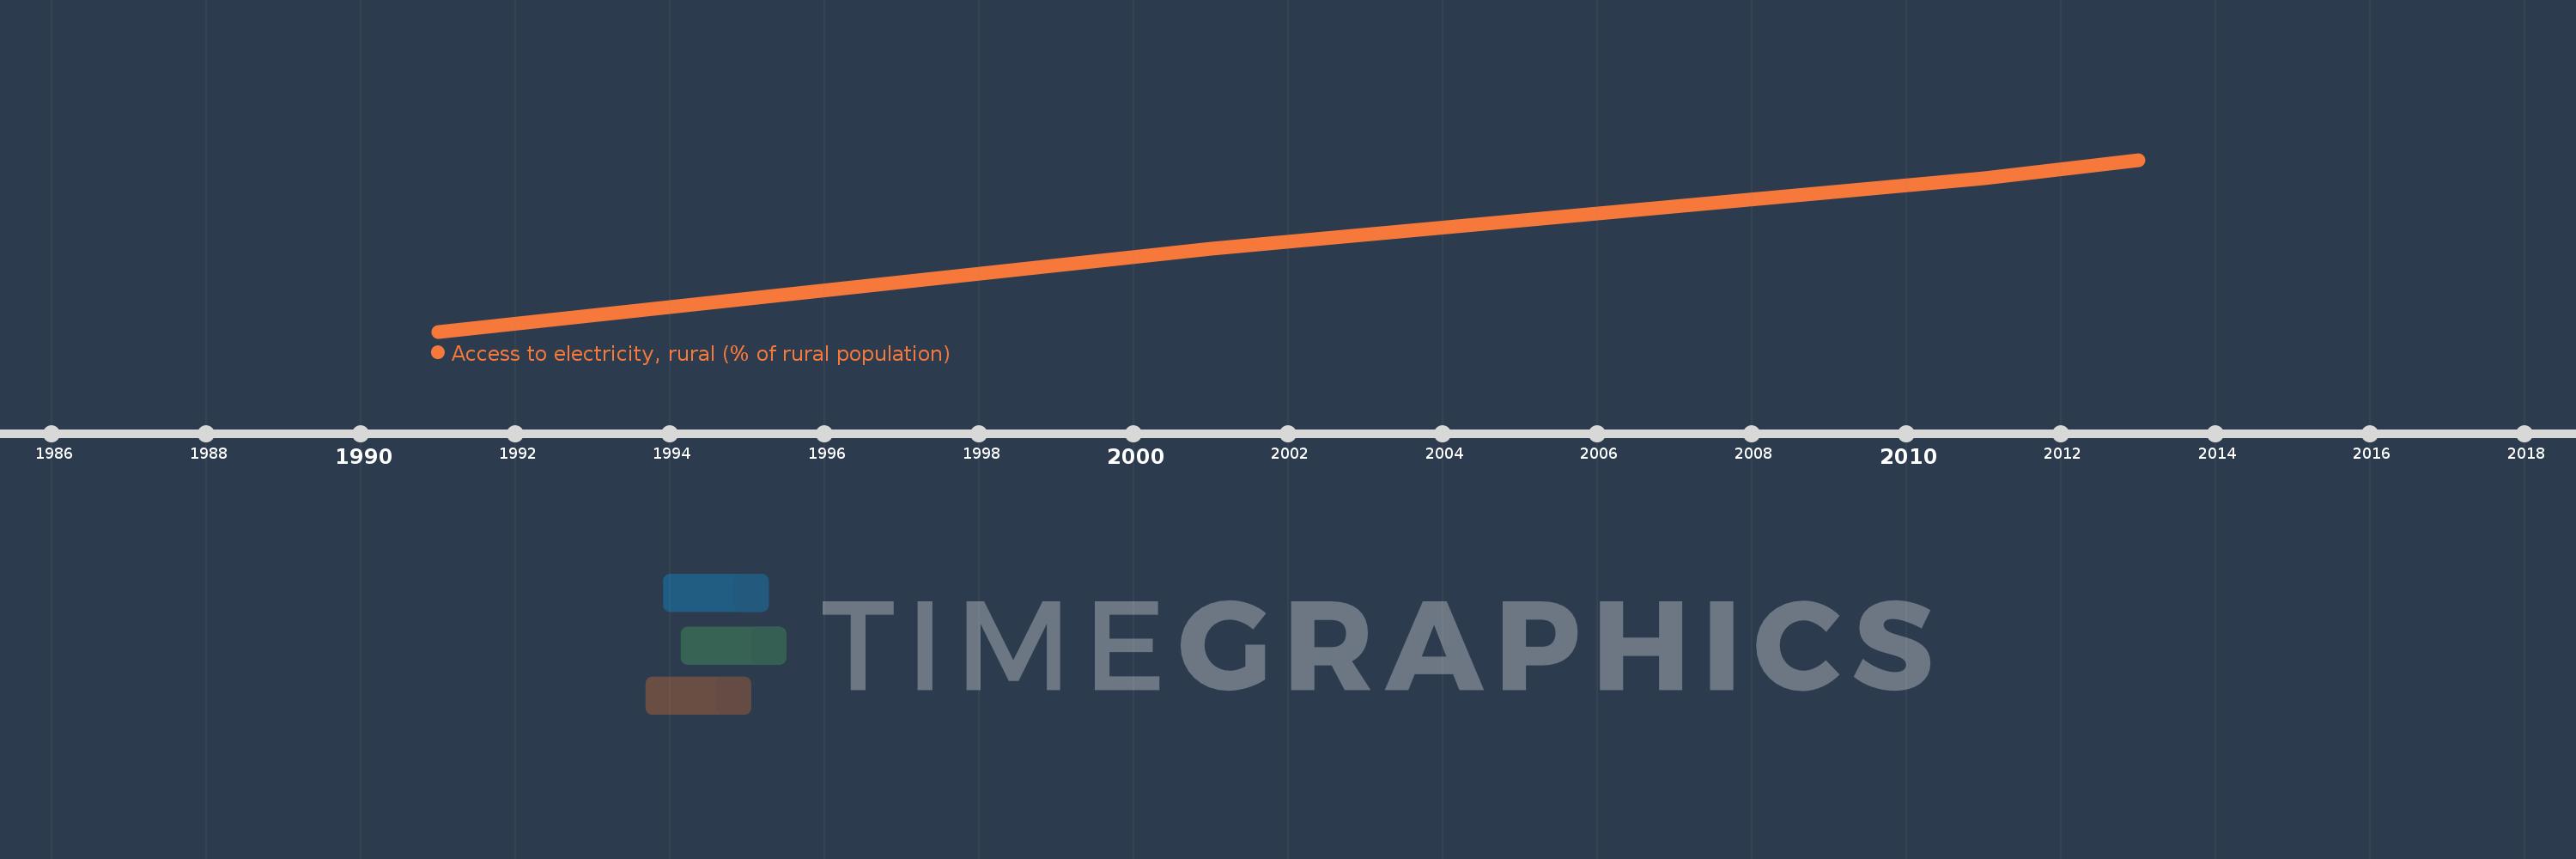
This timeline shows a graph from 1991 to 2013 of Latin America & the Caribbean (IDA & IBRD countries). No data until 1990. Number of actual observations by date: 4.
Source name:
World Development Indicators
Source organization:
World Bank, Sustainable Energy for all (SE4ALL) database from World Bank, Global Electrification database.
Categories, topics:
Agriculture & Rural Development, Energy & Mining
Last updated:
apr 23, 2017
Indicators value changes by year
Meaning:
77.688
Minimum:
64.196
jan 1, 1991
Maximum:
86.921
jan 1, 2013
At the date of observation
Value
Absolute change
Change from the previous value
jan 1, 1991
64.196
+64.196
0.0%
jan 1, 2001
75.138
+10.942
17.04%
jan 1, 2011
84.498
+9.36
12.46%
jan 1, 2013
86.921
+2.423
2.87%
Ranking of countries by current statistics by years