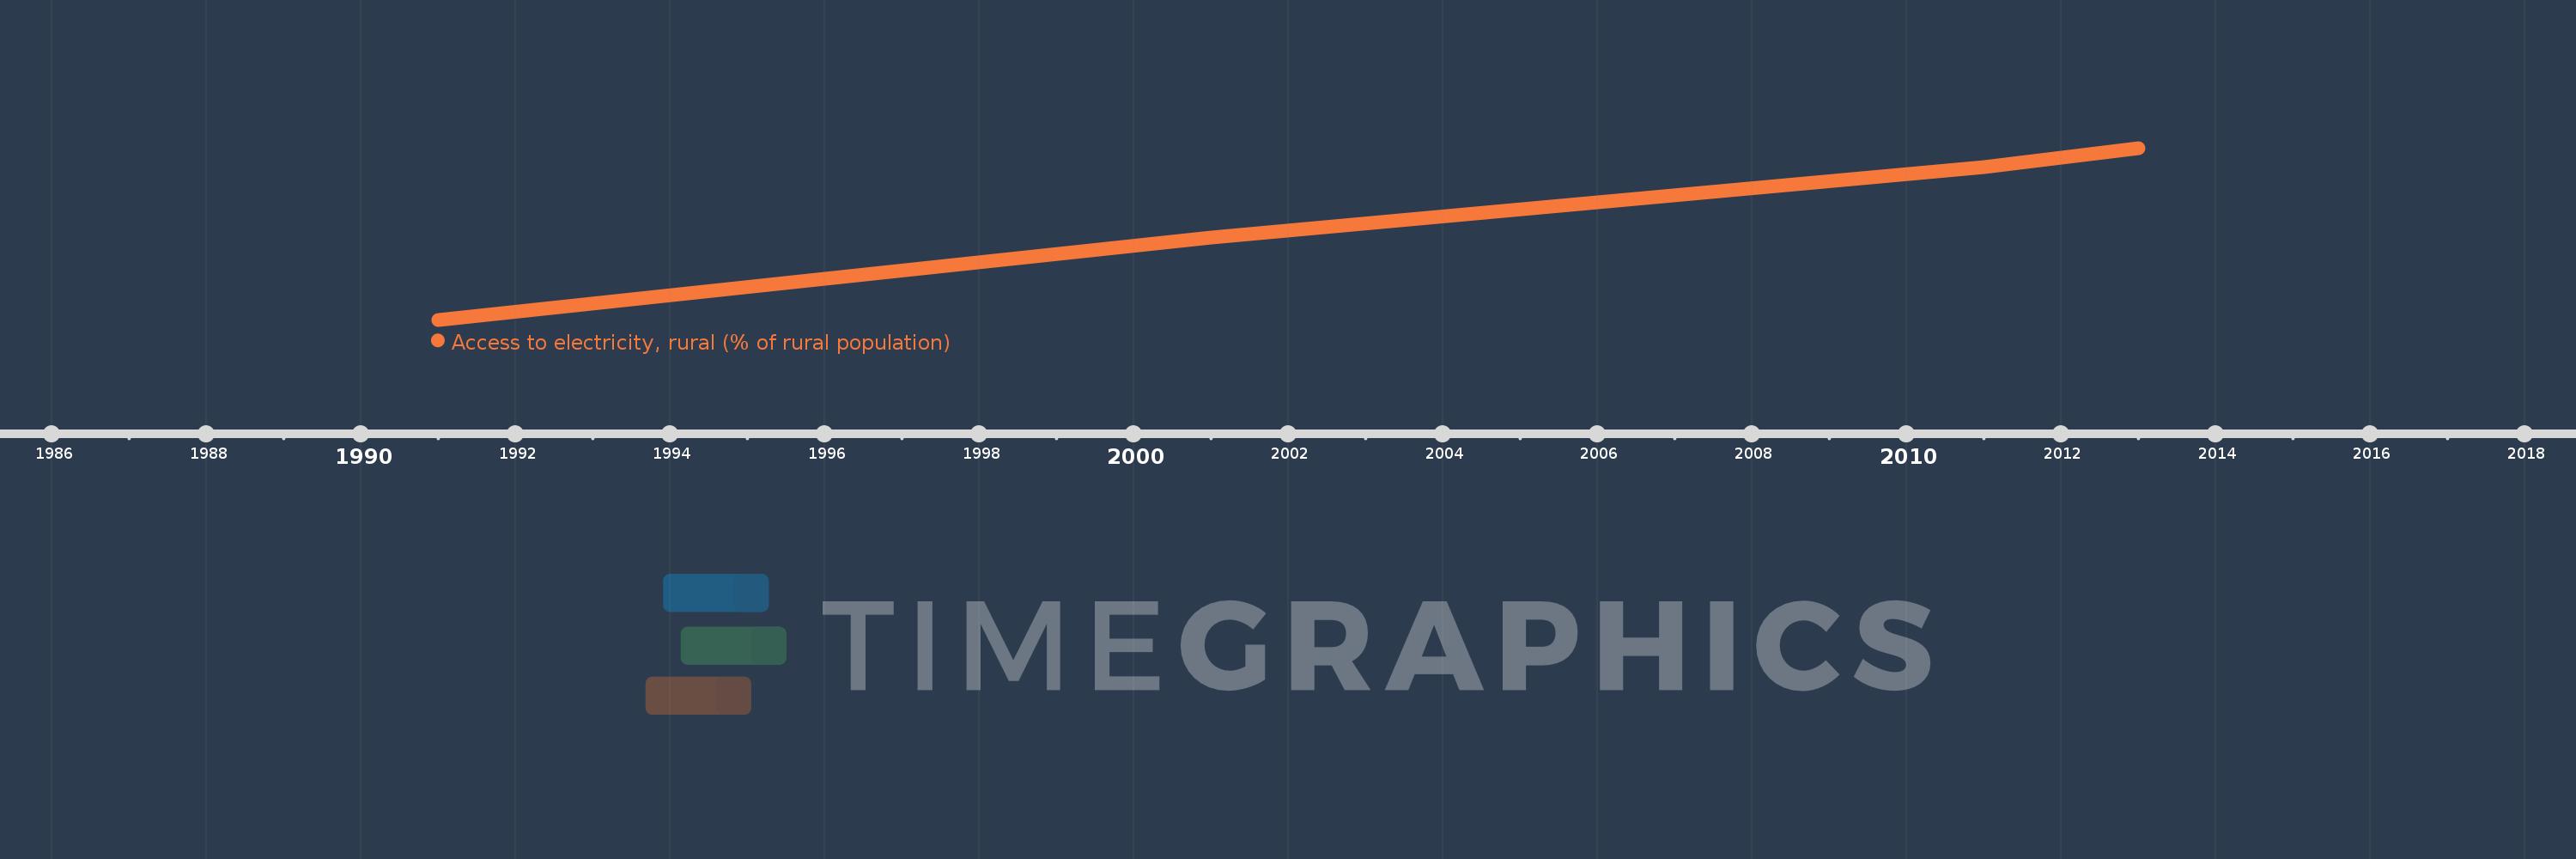
This timeline shows a graph from 1991 to 2013 of Latin America & Caribbean (excluding high income). No data until 1990. Number of actual observations by date: 4.
Source name:
World Development Indicators
Source organization:
World Bank, Sustainable Energy for all (SE4ALL) database from World Bank, Global Electrification database.
Categories, topics:
Agriculture & Rural Development, Energy & Mining
Last updated:
apr 23, 2017
Indicators value changes by year
Meaning:
77.606
Minimum:
64.254
jan 1, 1991
Maximum:
86.807
jan 1, 2013
At the date of observation
Value
Absolute change
Change from the previous value
jan 1, 1991
64.254
+64.254
0.0%
jan 1, 2001
75.038
+10.784
16.78%
jan 1, 2011
84.326
+9.288
12.38%
jan 1, 2013
86.807
+2.481
2.94%
Ranking of countries by current statistics by years