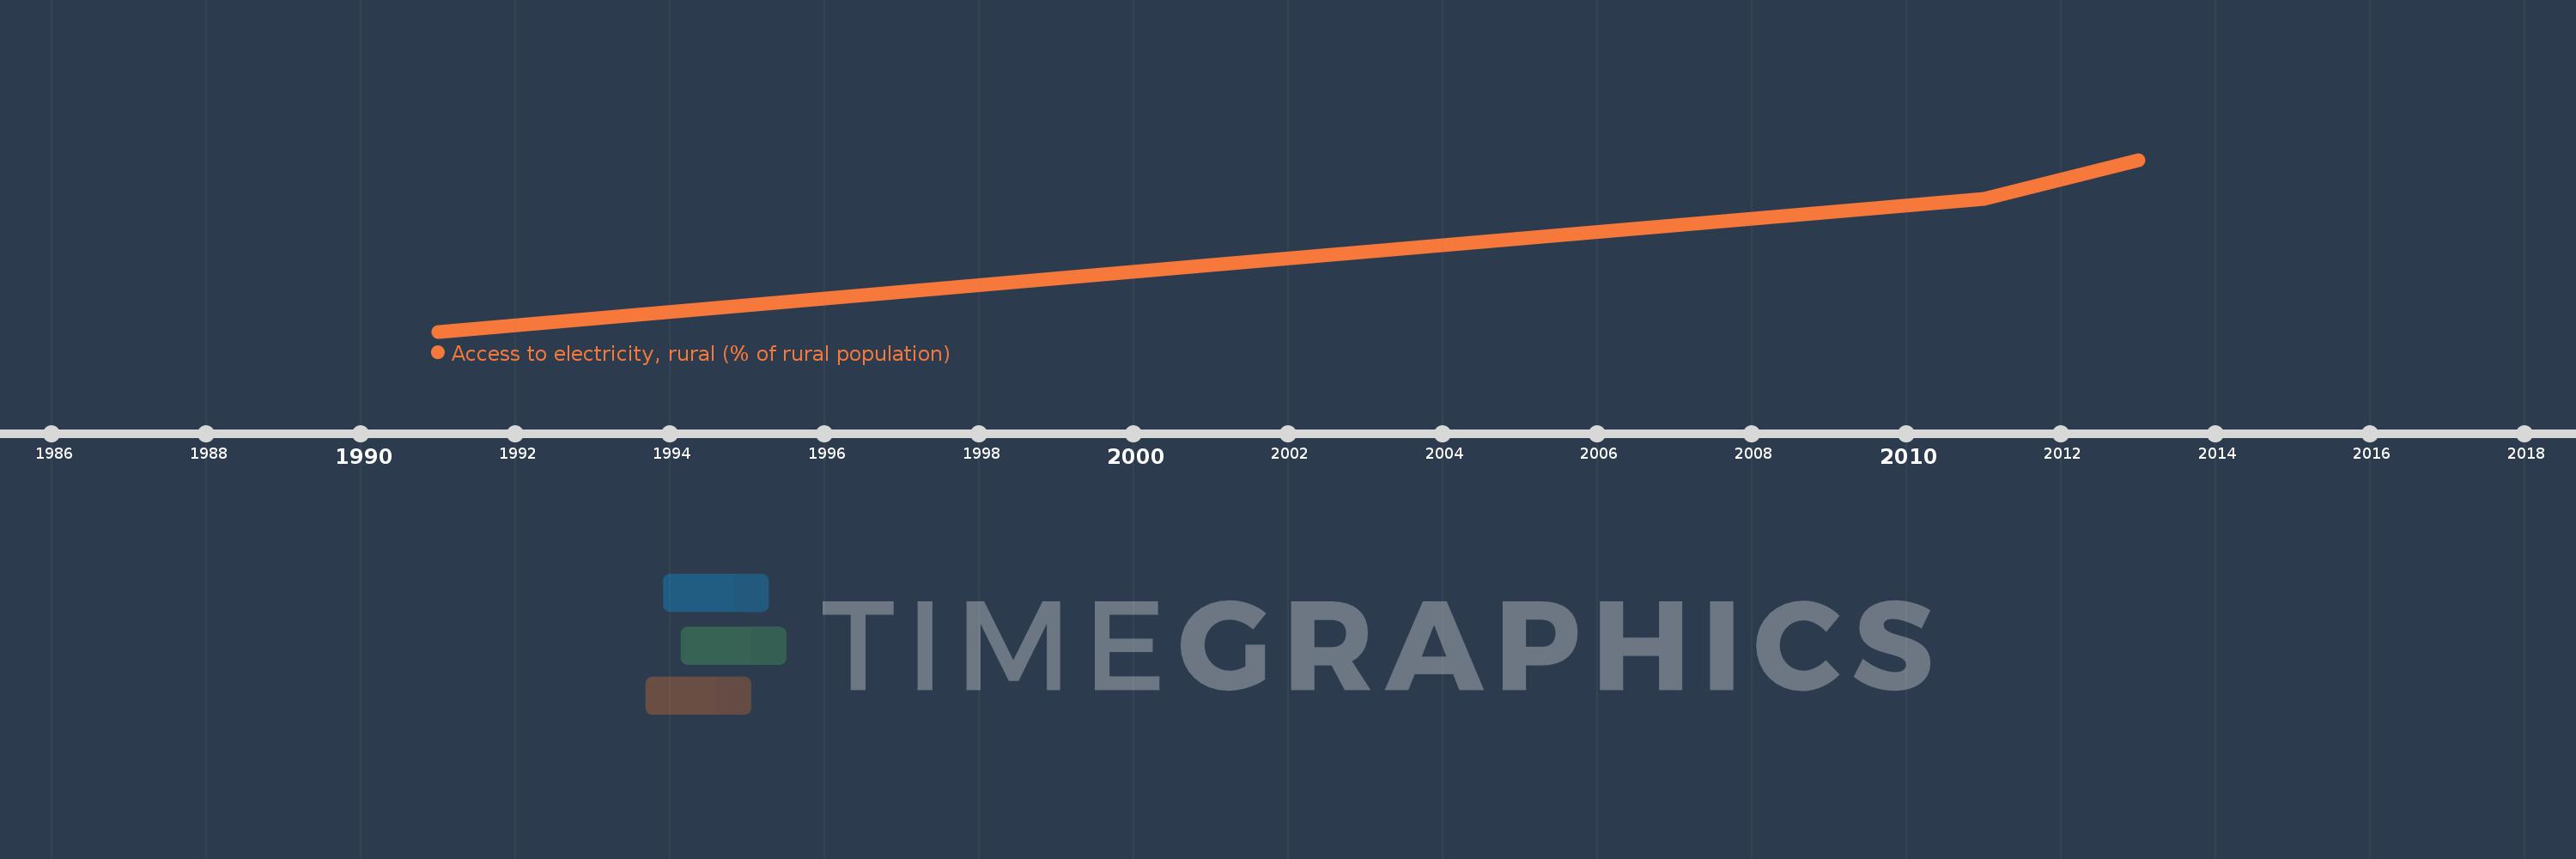
This timeline shows a graph from 1991 to 2013 of Fragile and conflict affected situations. No data until 1990. Number of actual observations by date: 4.
Source name:
World Development Indicators
Source organization:
World Bank, Sustainable Energy for all (SE4ALL) database from World Bank, Global Electrification database.
Categories, topics:
Agriculture & Rural Development, Energy & Mining
Last updated:
apr 23, 2017
Indicators value changes by year
Meaning:
18.841
Minimum:
14.03
jan 1, 1991
Maximum:
22.938
jan 1, 2013
At the date of observation
Value
Absolute change
Change from the previous value
jan 1, 1991
14.03
+14.03
0.0%
jan 1, 2001
17.469
+3.44
24.52%
jan 1, 2011
20.926
+3.456
19.79%
jan 1, 2013
22.938
+2.013
9.62%
Ranking of countries by current statistics by years