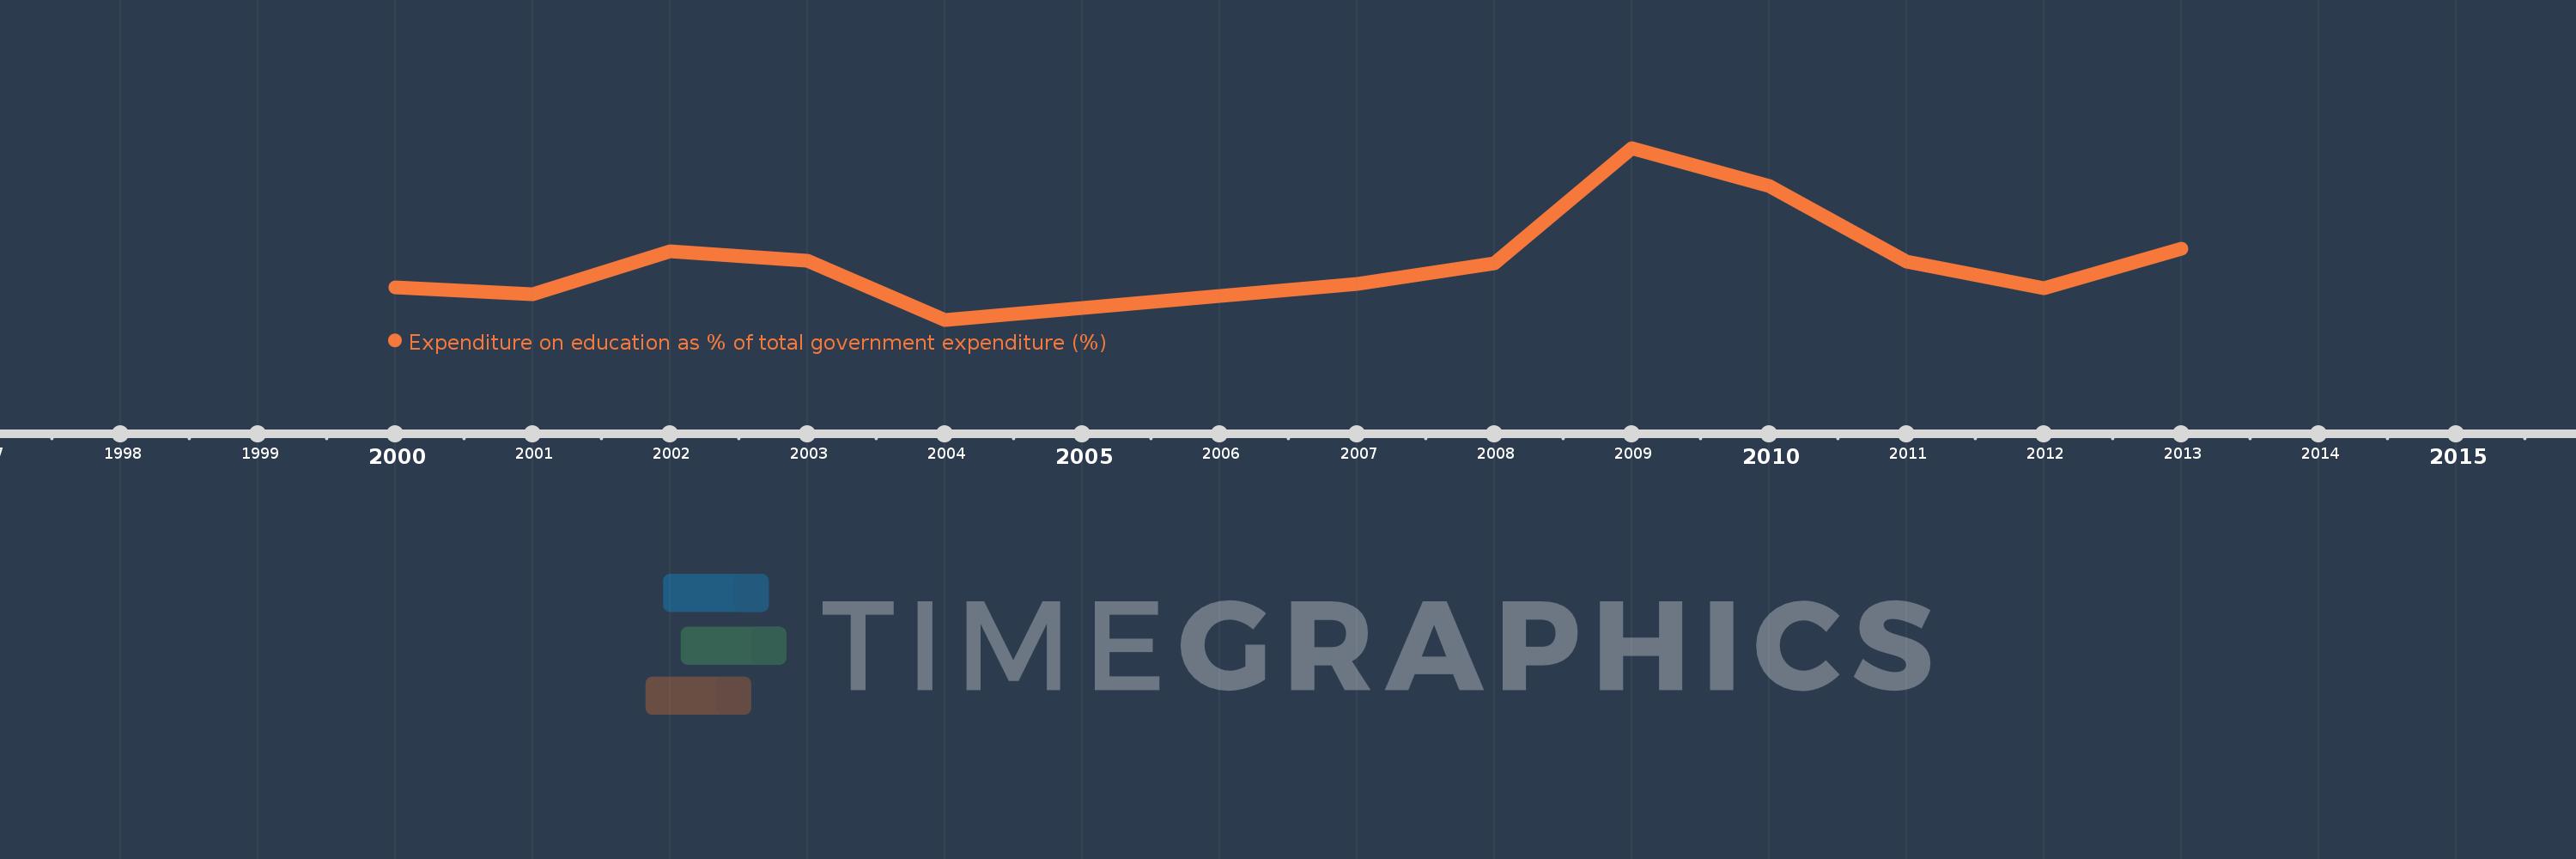
This timeline shows a graph from 2000 to 2013 of Latin America & Caribbean (excluding high income). No data until 1999. Number of actual observations by date: 12.
Source name:
World Development Indicators
Source organization:
UNESCO Institute for Statistics
Categories, topics:
Education
Last updated:
apr 23, 2017
Indicators value changes by year
Meaning:
16.505
Minimum:
15.212
jan 1, 2004
Maximum:
18.8
jan 1, 2009
At the date of observation
Value
Absolute change
Change from the previous value
jan 1, 2000
15.88
+15.88
0.0%
jan 1, 2001
15.739
-0.141
-0.89%
jan 1, 2002
16.639
+0.9
5.72%
jan 1, 2003
16.443
-0.196
-1.18%
jan 1, 2004
15.212
-1.231
-7.49%
jan 1, 2007
15.962
+0.75
4.93%
jan 1, 2008
16.384
+0.422
2.65%
jan 1, 2009
18.8
+2.416
14.75%
jan 1, 2010
18.013
-0.788
-4.19%
jan 1, 2011
16.419
-1.594
-8.85%
jan 1, 2012
15.873
-0.546
-3.33%
jan 1, 2013
16.699
+0.827
5.21%
Ranking of countries by current statistics by years