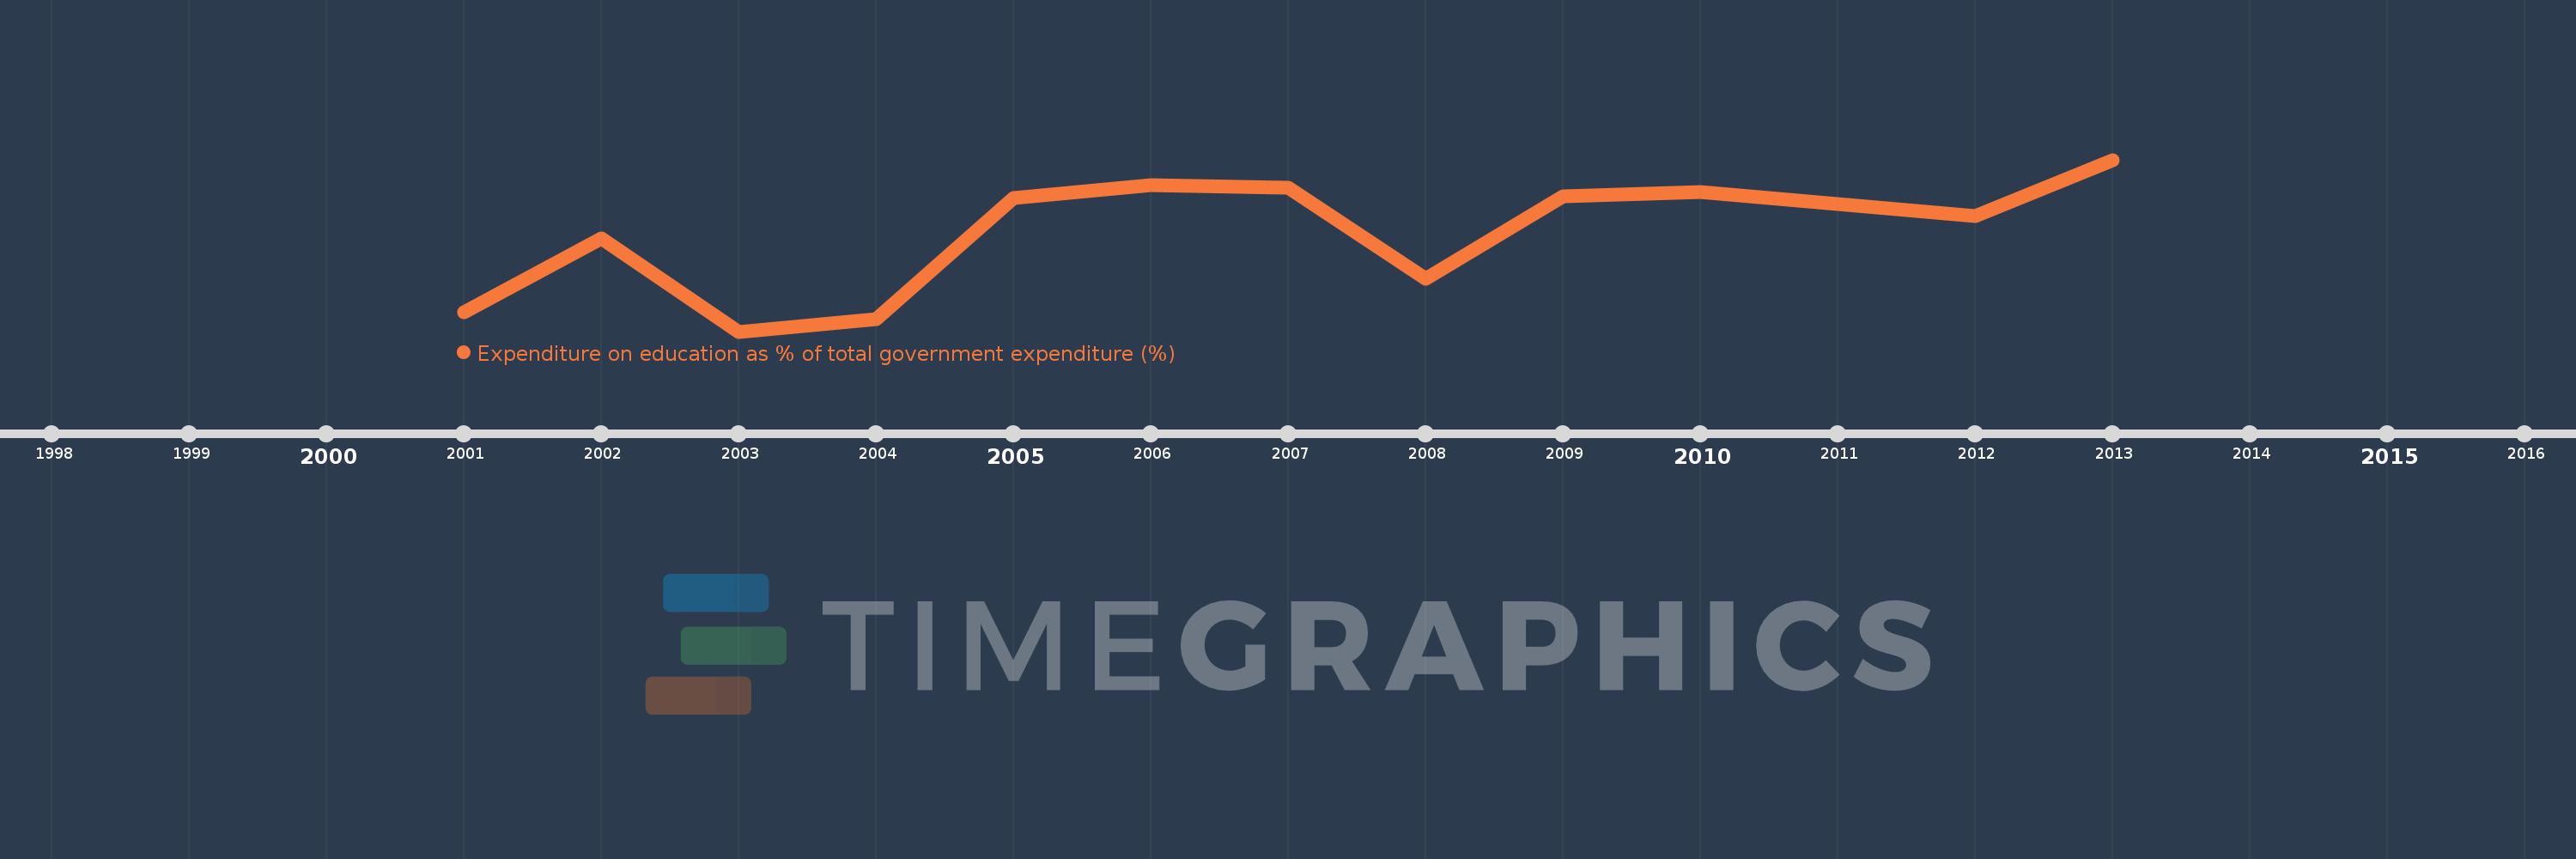
This timeline shows a graph from 2001 to 2013 of Europe & Central Asia (excluding high income). No data until 2000. Number of actual observations by date: 12.
Source name:
World Development Indicators
Source organization:
UNESCO Institute for Statistics
Categories, topics:
Education
Last updated:
apr 23, 2017
Indicators value changes by year
Meaning:
12.403
Minimum:
11.397
jan 1, 2003
Maximum:
13.181
jan 1, 2013
At the date of observation
Value
Absolute change
Change from the previous value
jan 1, 2001
11.597
+11.597
0.0%
jan 1, 2002
12.362
+0.765
6.59%
jan 1, 2003
11.397
-0.965
-7.81%
jan 1, 2004
11.523
+0.126
1.11%
jan 1, 2005
12.782
+1.258
10.92%
jan 1, 2006
12.915
+0.133
1.04%
jan 1, 2007
12.895
-0.02
-0.15%
jan 1, 2008
11.945
-0.951
-7.37%
jan 1, 2009
12.8
+0.856
7.17%
jan 1, 2010
12.849
+0.048
0.38%
jan 1, 2012
12.593
-0.255
-1.99%
jan 1, 2013
13.181
+0.587
4.66%
Ranking of countries by current statistics by years