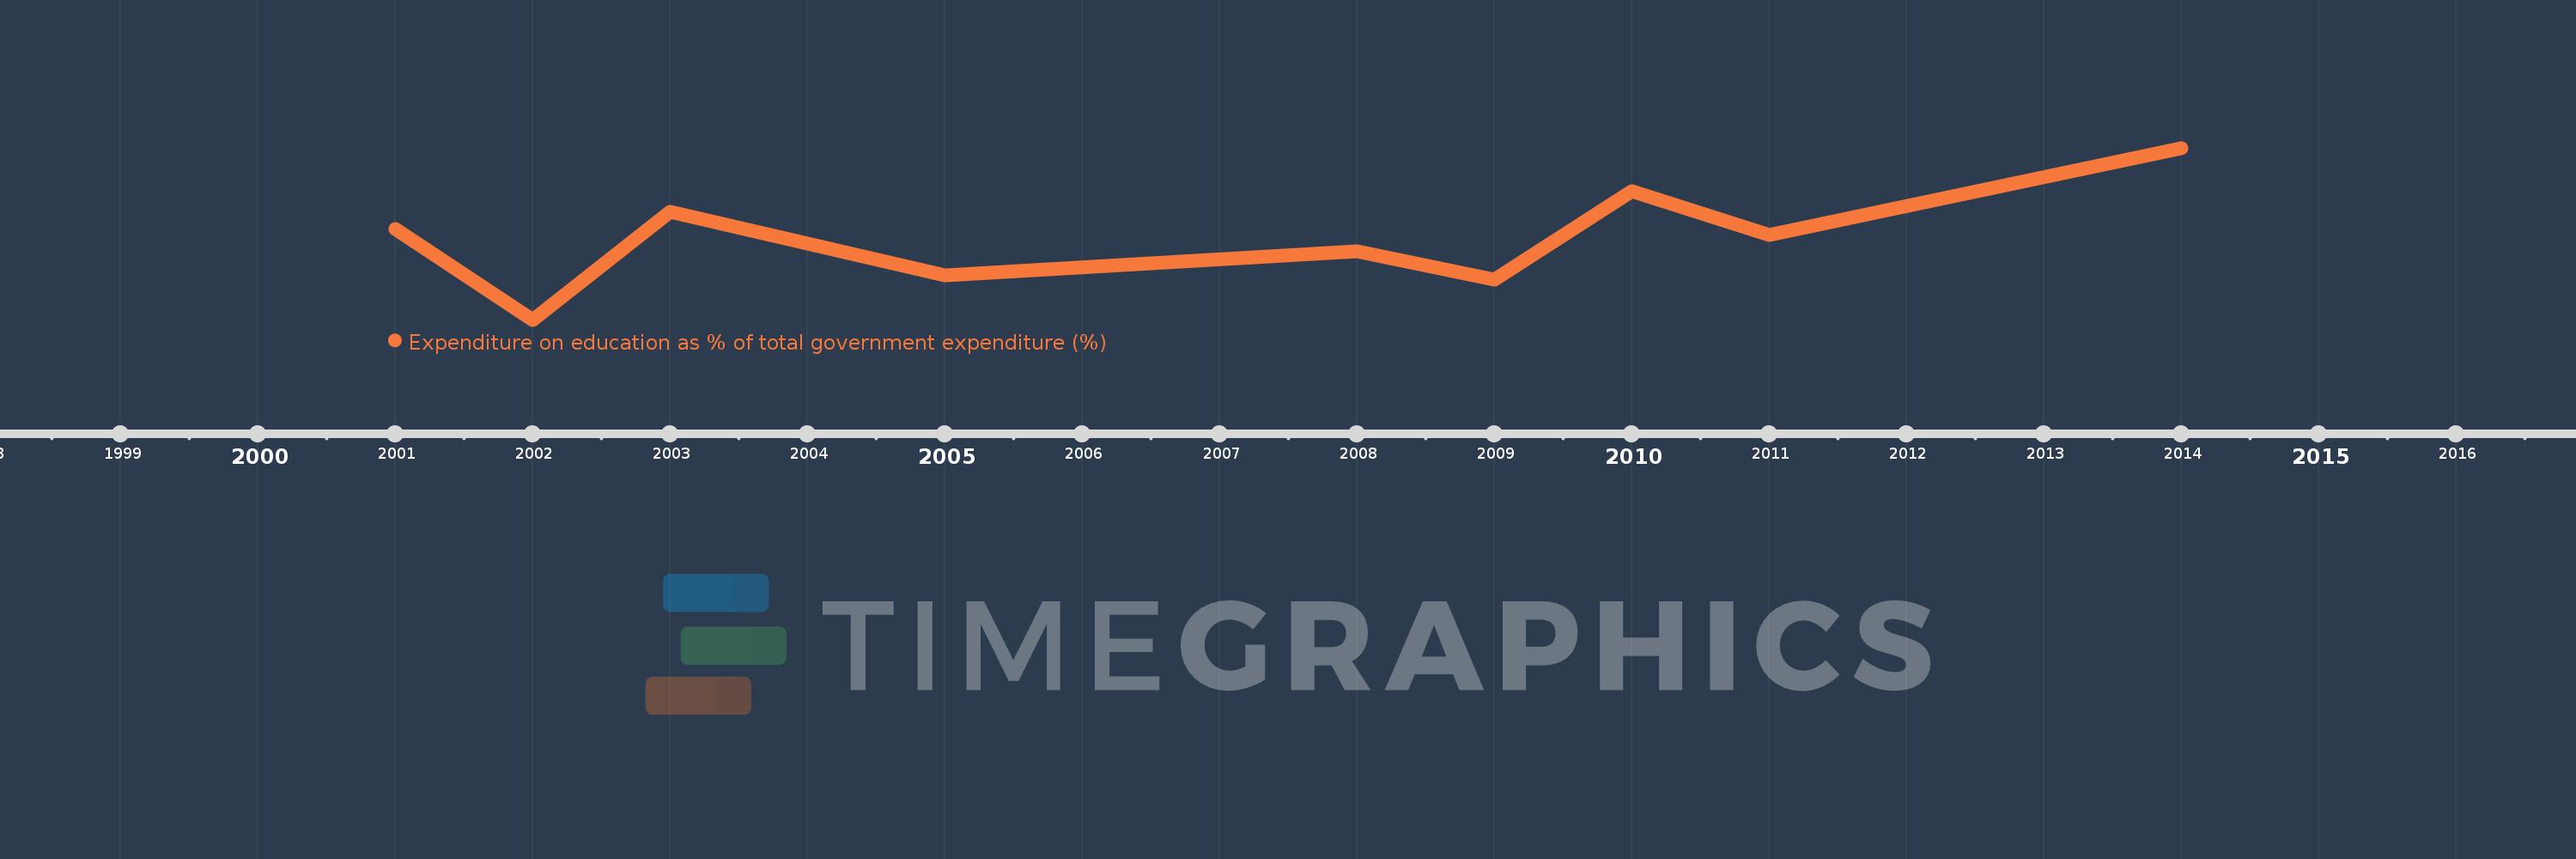
This timeline shows a graph from 2001 to 2014 of East Asia & Pacific (IDA & IBRD countries). No data until 2000. Number of actual observations by date: 9.
Source name:
World Development Indicators
Source organization:
UNESCO Institute for Statistics
Categories, topics:
Education
Last updated:
apr 23, 2017
Indicators value changes by year
Meaning:
15.367
Minimum:
12.755
jan 1, 2002
Maximum:
18.227
jan 1, 2014
At the date of observation
Value
Absolute change
Change from the previous value
jan 1, 2001
15.641
+15.641
0.0%
jan 1, 2002
12.755
-2.886
-18.45%
jan 1, 2003
16.205
+3.45
27.05%
jan 1, 2005
14.17
-2.034
-12.55%
jan 1, 2008
14.944
+0.774
5.46%
jan 1, 2009
14.039
-0.906
-6.06%
jan 1, 2010
16.853
+2.815
20.05%
jan 1, 2011
15.467
-1.387
-8.23%
jan 1, 2014
18.227
+2.76
17.85%
Ranking of countries by current statistics by years