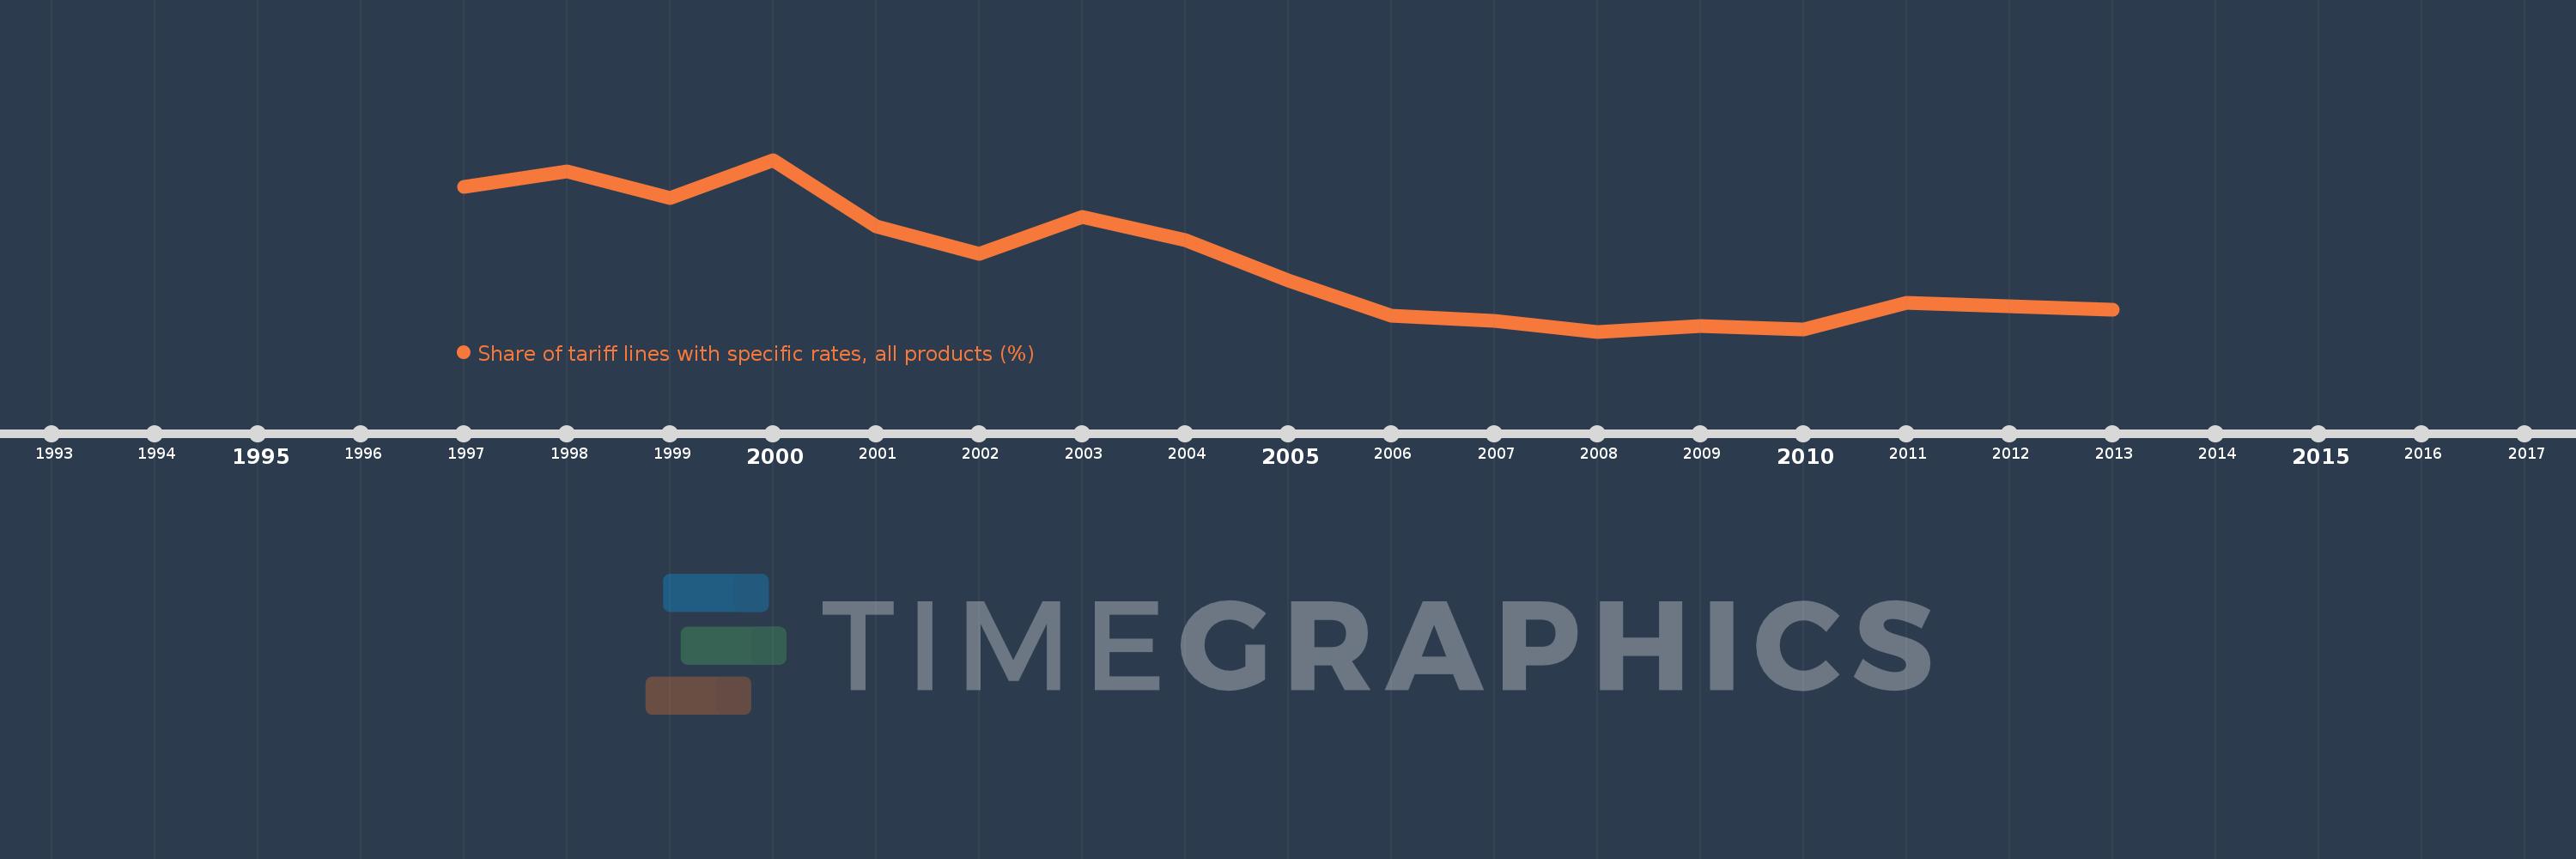
This timeline shows a graph from 1997 to 2013 of High income. No data until 1996. Number of actual observations by date: 16.
Source name:
World Development Indicators
Source organization:
World Bank staff estimates using the World Integrated Trade Solution system, based on data from United Nations Conference on Trade and Development's Trade Analysis and Information System (TRAINS) database.
Categories, topics:
Private Sector, Trade
Last updated:
apr 23, 2017
Indicators value changes by year
Meaning:
7.092
Minimum:
4.437
jan 1, 2008
Maximum:
10.854
jan 1, 2000
At the date of observation
Value
Absolute change
Change from the previous value
jan 1, 1997
9.839
+9.839
0.0%
jan 1, 1998
10.436
+0.597
6.07%
jan 1, 1999
9.422
-1.014
-9.71%
jan 1, 2000
10.854
+1.431
15.19%
jan 1, 2001
8.375
-2.478
-22.83%
jan 1, 2002
7.349
-1.027
-12.26%
jan 1, 2003
8.722
+1.373
18.68%
jan 1, 2004
7.866
-0.855
-9.81%
jan 1, 2005
6.361
-1.505
-19.13%
jan 1, 2006
5.021
-1.34
-21.07%
jan 1, 2007
4.845
-0.176
-3.5%
jan 1, 2008
4.437
-0.408
-8.43%
jan 1, 2009
4.655
+0.218
4.92%
jan 1, 2010
4.53
-0.125
-2.68%
jan 1, 2011
5.518
+0.988
21.81%
jan 1, 2013
5.24
-0.278
-5.04%
Ranking of countries by current statistics by years