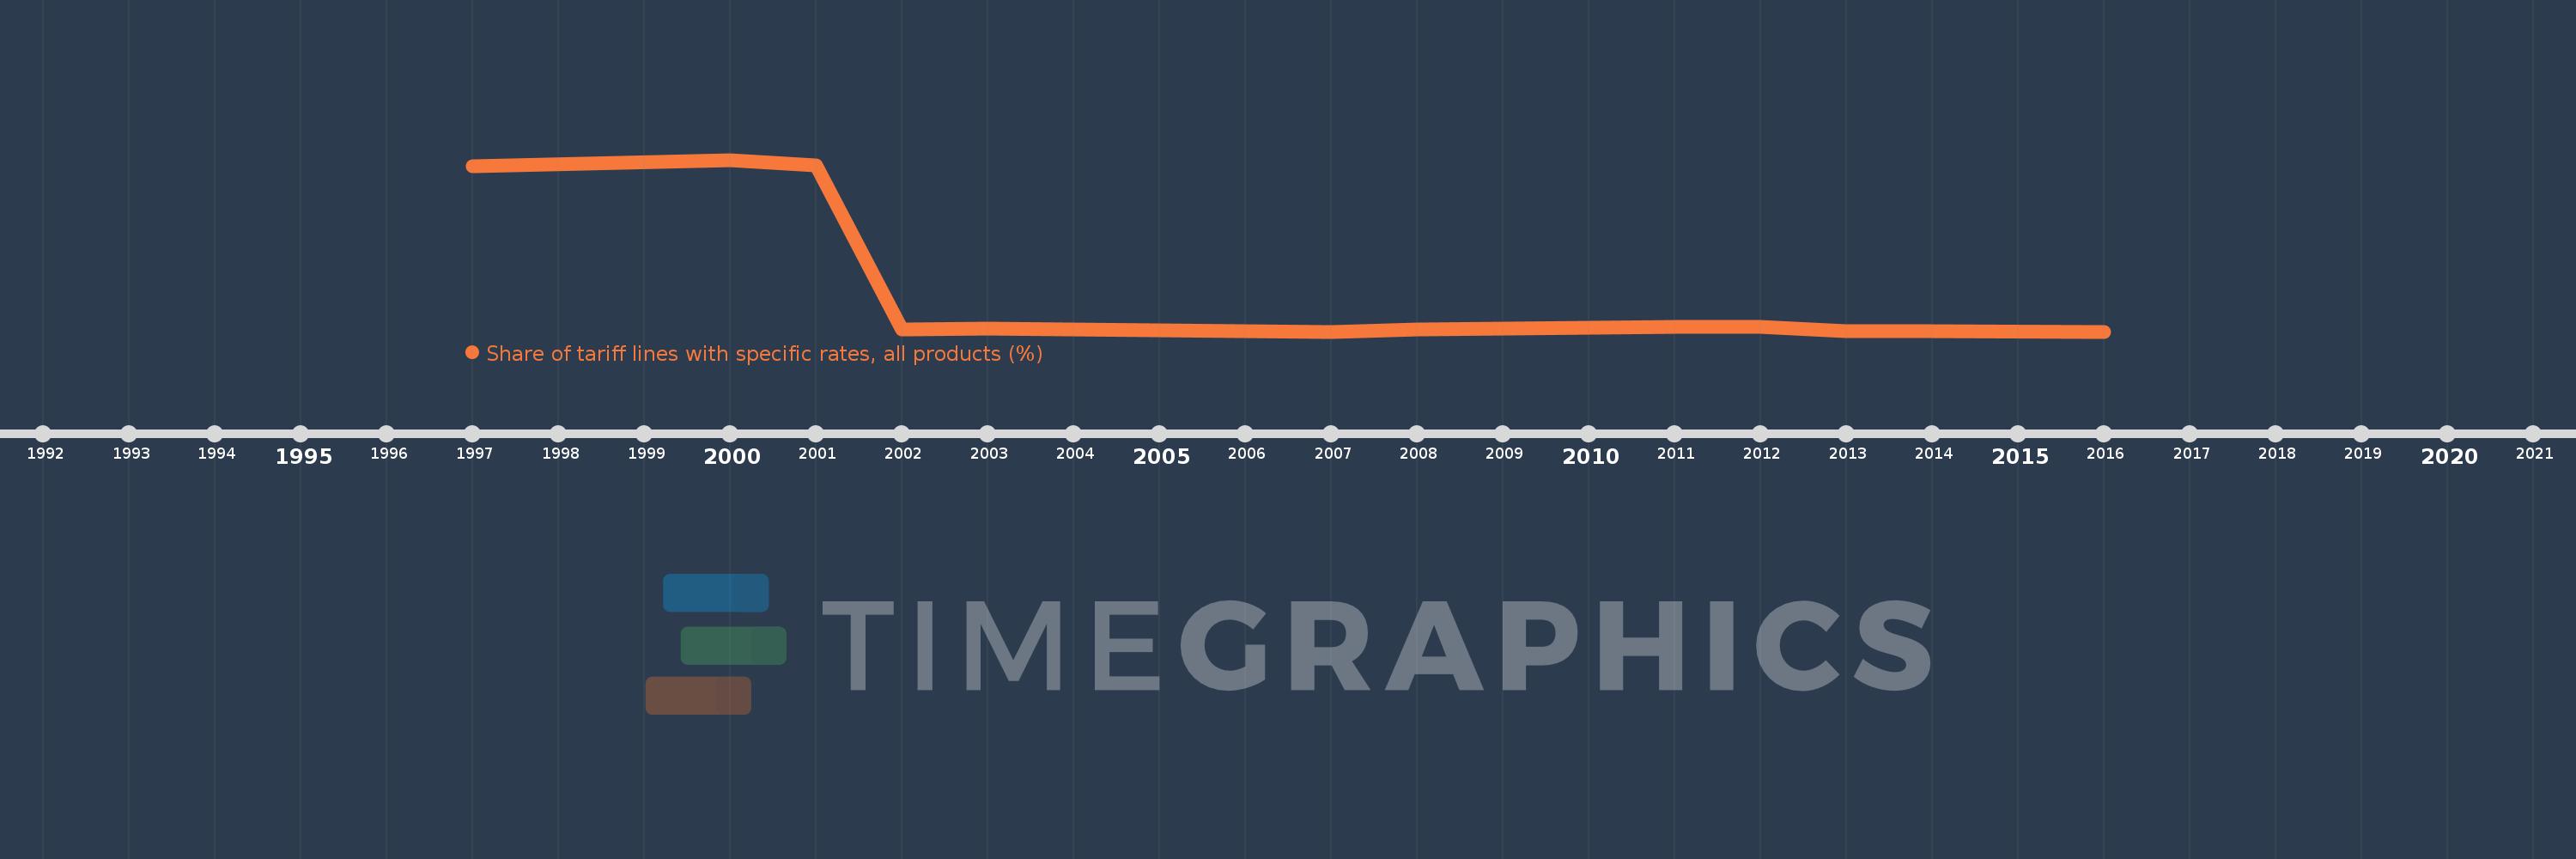
This timeline shows a graph from 1997 to 2016 of St. Vincent and the Grenadines. No data until 1996. Number of actual observations by date: 13.
Source name:
World Development Indicators
Source organization:
World Bank staff estimates using the World Integrated Trade Solution system, based on data from United Nations Conference on Trade and Development's Trade Analysis and Information System (TRAINS) database.
Categories, topics:
Private Sector, Trade
Last updated:
apr 23, 2017
Indicators value changes by year
Meaning:
8.301
Minimum:
0.0
jan 1, 2007
Maximum:
35.434
jan 1, 2000
At the date of observation
Value
Absolute change
Change from the previous value
jan 1, 1997
34.133
+34.133
0.0%
jan 1, 2000
35.434
+1.301
3.81%
jan 1, 2001
34.215
-1.219
-3.44%
jan 1, 2002
0.456
-33.758
-98.67%
jan 1, 2003
0.551
+0.094
20.67%
jan 1, 2004
0.489
-0.062
-11.18%
jan 1, 2007
0.0
-0.489
-100.0%
jan 1, 2008
0.531
+0.531
%
jan 1, 2011
0.99
+0.459
86.47%
jan 1, 2012
0.922
-0.068
-6.84%
jan 1, 2013
0.097
-0.825
-89.48%
jan 1, 2014
0.097
0.0
0.0%
jan 1, 2016
0.0
-0.097
-100.0%
Ranking of countries by current statistics by years