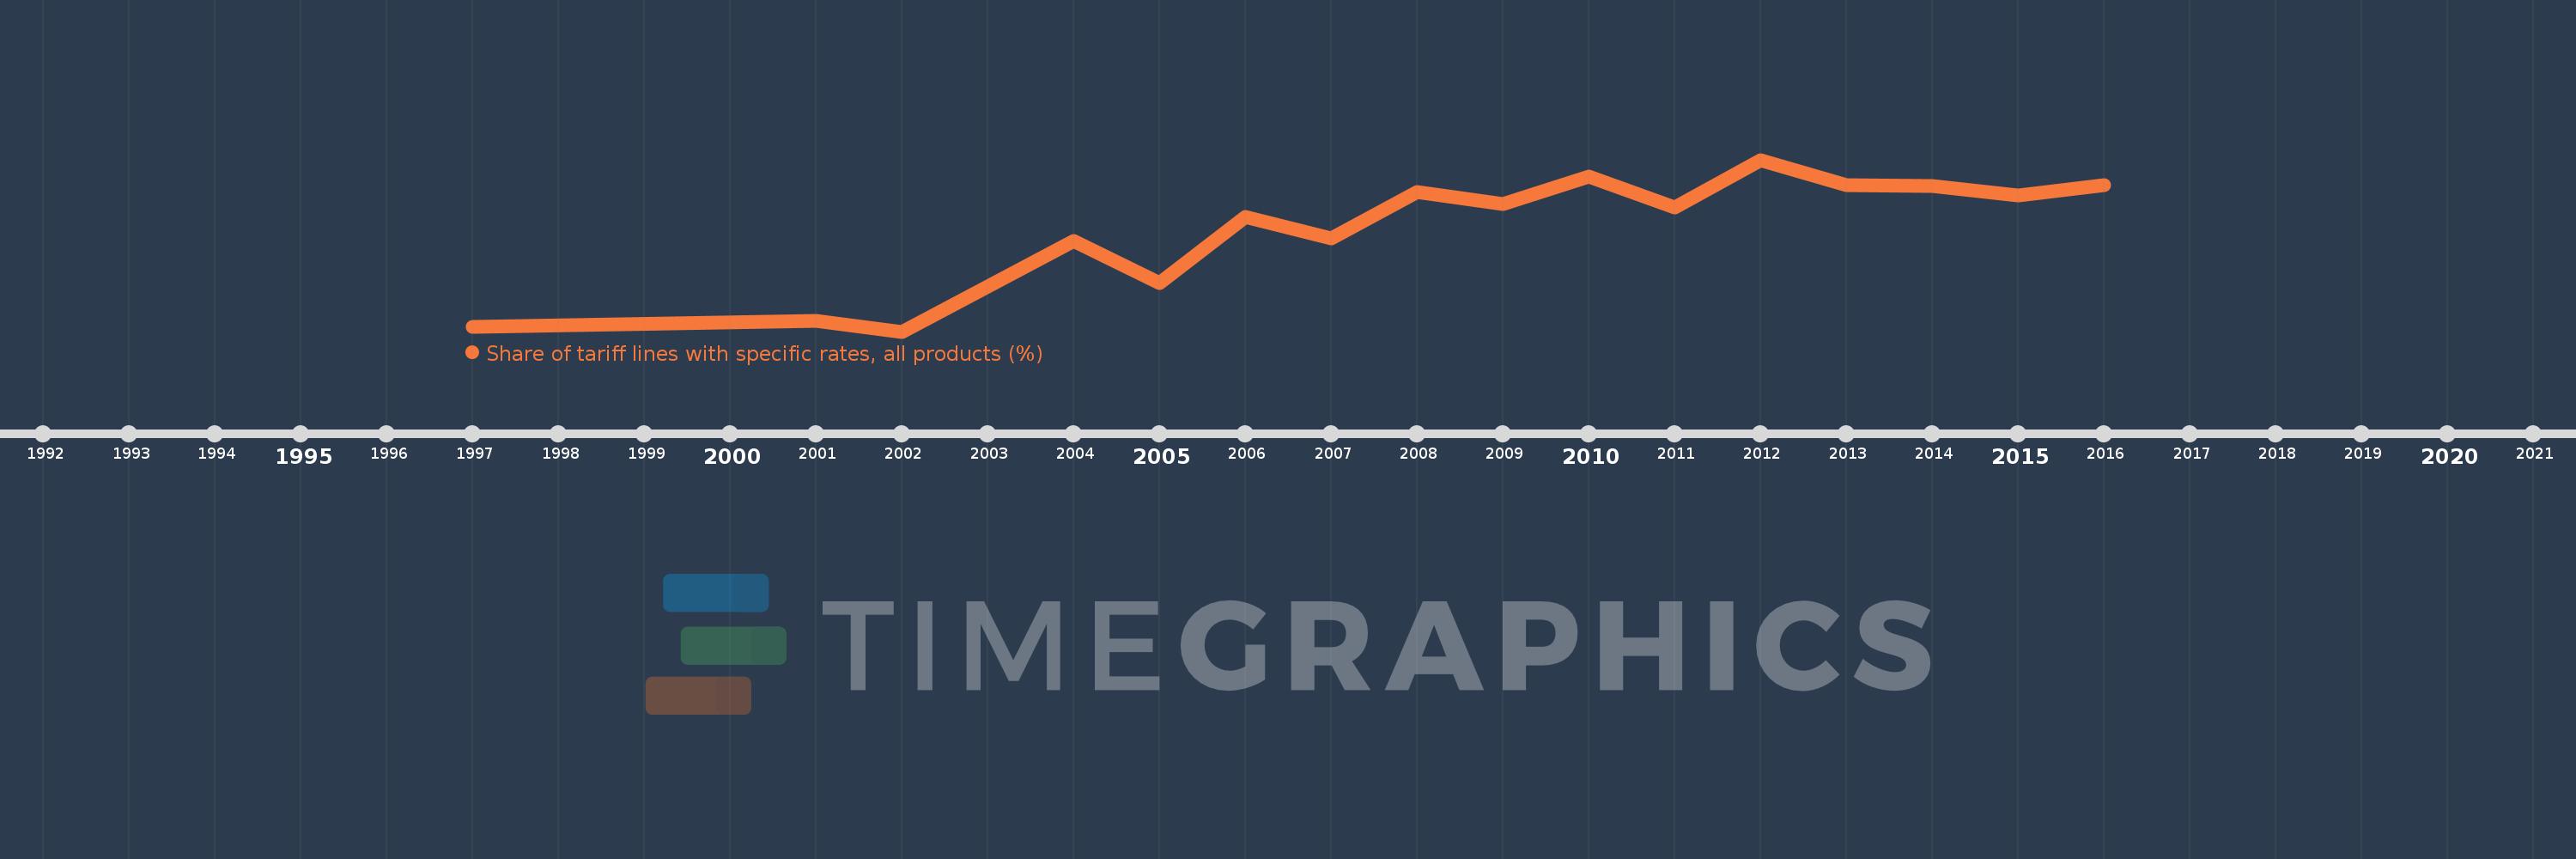
This timeline shows a graph from 1997 to 2016 of Moldova. No data until 1996. Number of actual observations by date: 16.
Source name:
World Development Indicators
Source organization:
World Bank staff estimates using the World Integrated Trade Solution system, based on data from United Nations Conference on Trade and Development's Trade Analysis and Information System (TRAINS) database.
Categories, topics:
Private Sector, Trade
Last updated:
apr 23, 2017
Indicators value changes by year
Meaning:
2.285
Minimum:
0.687
jan 1, 2002
Maximum:
3.343
jan 1, 2012
At the date of observation
Value
Absolute change
Change from the previous value
jan 1, 1997
0.757
+0.757
0.0%
jan 1, 2001
0.853
+0.096
12.69%
jan 1, 2002
0.687
-0.166
-19.47%
jan 1, 2004
2.084
+1.397
203.31%
jan 1, 2005
1.435
-0.65
-31.16%
jan 1, 2006
2.463
+1.028
71.66%
jan 1, 2007
2.128
-0.335
-13.6%
jan 1, 2008
2.842
+0.714
33.55%
jan 1, 2009
2.655
-0.187
-6.57%
jan 1, 2010
3.081
+0.425
16.02%
jan 1, 2011
2.601
-0.479
-15.55%
jan 1, 2012
3.343
+0.742
28.51%
jan 1, 2013
2.952
-0.391
-11.7%
jan 1, 2014
2.939
-0.013
-0.44%
jan 1, 2015
2.789
-0.15
-5.1%
jan 1, 2016
2.955
+0.165
5.93%
Ranking of countries by current statistics by years