33
/
AIzaSyB4mHJ5NPEv-XzF7P6NDYXjlkCWaeKw5bc
November 30, 2025
286142
Zambia
ZMB
true
2
1
Machinery and transport equipment (% of value added in manufacturing)
1995,1991,1983,1982,1981,1976,1975,1974,1973,1972,1971,1970,1969,1968,1967,1966,1965,1964
Create a timeline
Public Timelines
For education
For educational institutions
For teachers
For students
Cabinet
For educational institutions
For teachers
For students
Open cabinet
FAQ
Close
Create a timeline
Public timelines
FAQ
About & Feedback
Terms
Privacy
FAQ
Support 24/7
Cabinet
Get premium
Donate
Download
Global statistics library
→
Zambia
→
Machinery and transport equipment (% of value added in manufacturing)
This statistics in other country:
Albania
Algeria
Argentina
Australia
Austria
Azerbaijan
Bahamas, The
Bahrain
Bangladesh
Barbados
Belarus
Belgium
Belize
Benin
Bolivia
Bosnia and Herzegovina
Botswana
Brazil
Bulgaria
Burkina Faso
Burundi
Cambodia
Cameroon
Canada
Central African Republic
Chile
China
Colombia
Congo, Rep.
Costa Rica
Cote d'Ivoire
Croatia
Cuba
Cyprus
Czech Republic
Denmark
Dominican Republic
Ecuador
Egypt, Arab Rep.
El Salvador
Eritrea
Estonia
Ethiopia
Fiji
Finland
France
Gabon
Gambia, The
Georgia
Germany
Ghana
Greece
Guatemala
Honduras
Hong Kong SAR, China
Hungary
Iceland
India
Indonesia
Iran, Islamic Rep.
Iraq
Ireland
Israel
Italy
Jamaica
Japan
Jordan
Kazakhstan
Kenya
Korea, Rep.
Kuwait
Kyrgyz Republic
Lao PDR
Latvia
Lebanon
Libya
Lithuania
Luxembourg
Macao SAR, China
Macedonia, FYR
Madagascar
Malawi
Malaysia
Malta
Mauritius
Mexico
Moldova
Mongolia
Morocco
Mozambique
Namibia
Nepal
Netherlands
New Zealand
Nicaragua
Nigeria
Norway
Oman
Pakistan
Panama
Papua New Guinea
Paraguay
Peru
Philippines
Poland
Portugal
Puerto Rico
Qatar
Romania
Russian Federation
Saudi Arabia
Senegal
Serbia
Singapore
Slovak Republic
Slovenia
Somalia
South Africa
Spain
Sri Lanka
St. Lucia
Sudan
Swaziland
Sweden
Switzerland
Syrian Arab Republic
Tanzania
Thailand
Tonga
Trinidad and Tobago
Tunisia
Turkey
Uganda
Ukraine
United Arab Emirates
United Kingdom
United States
Uruguay
Venezuela, RB
Vietnam
West Bank and Gaza
Yemen, Rep.
Zambia
Timeline:
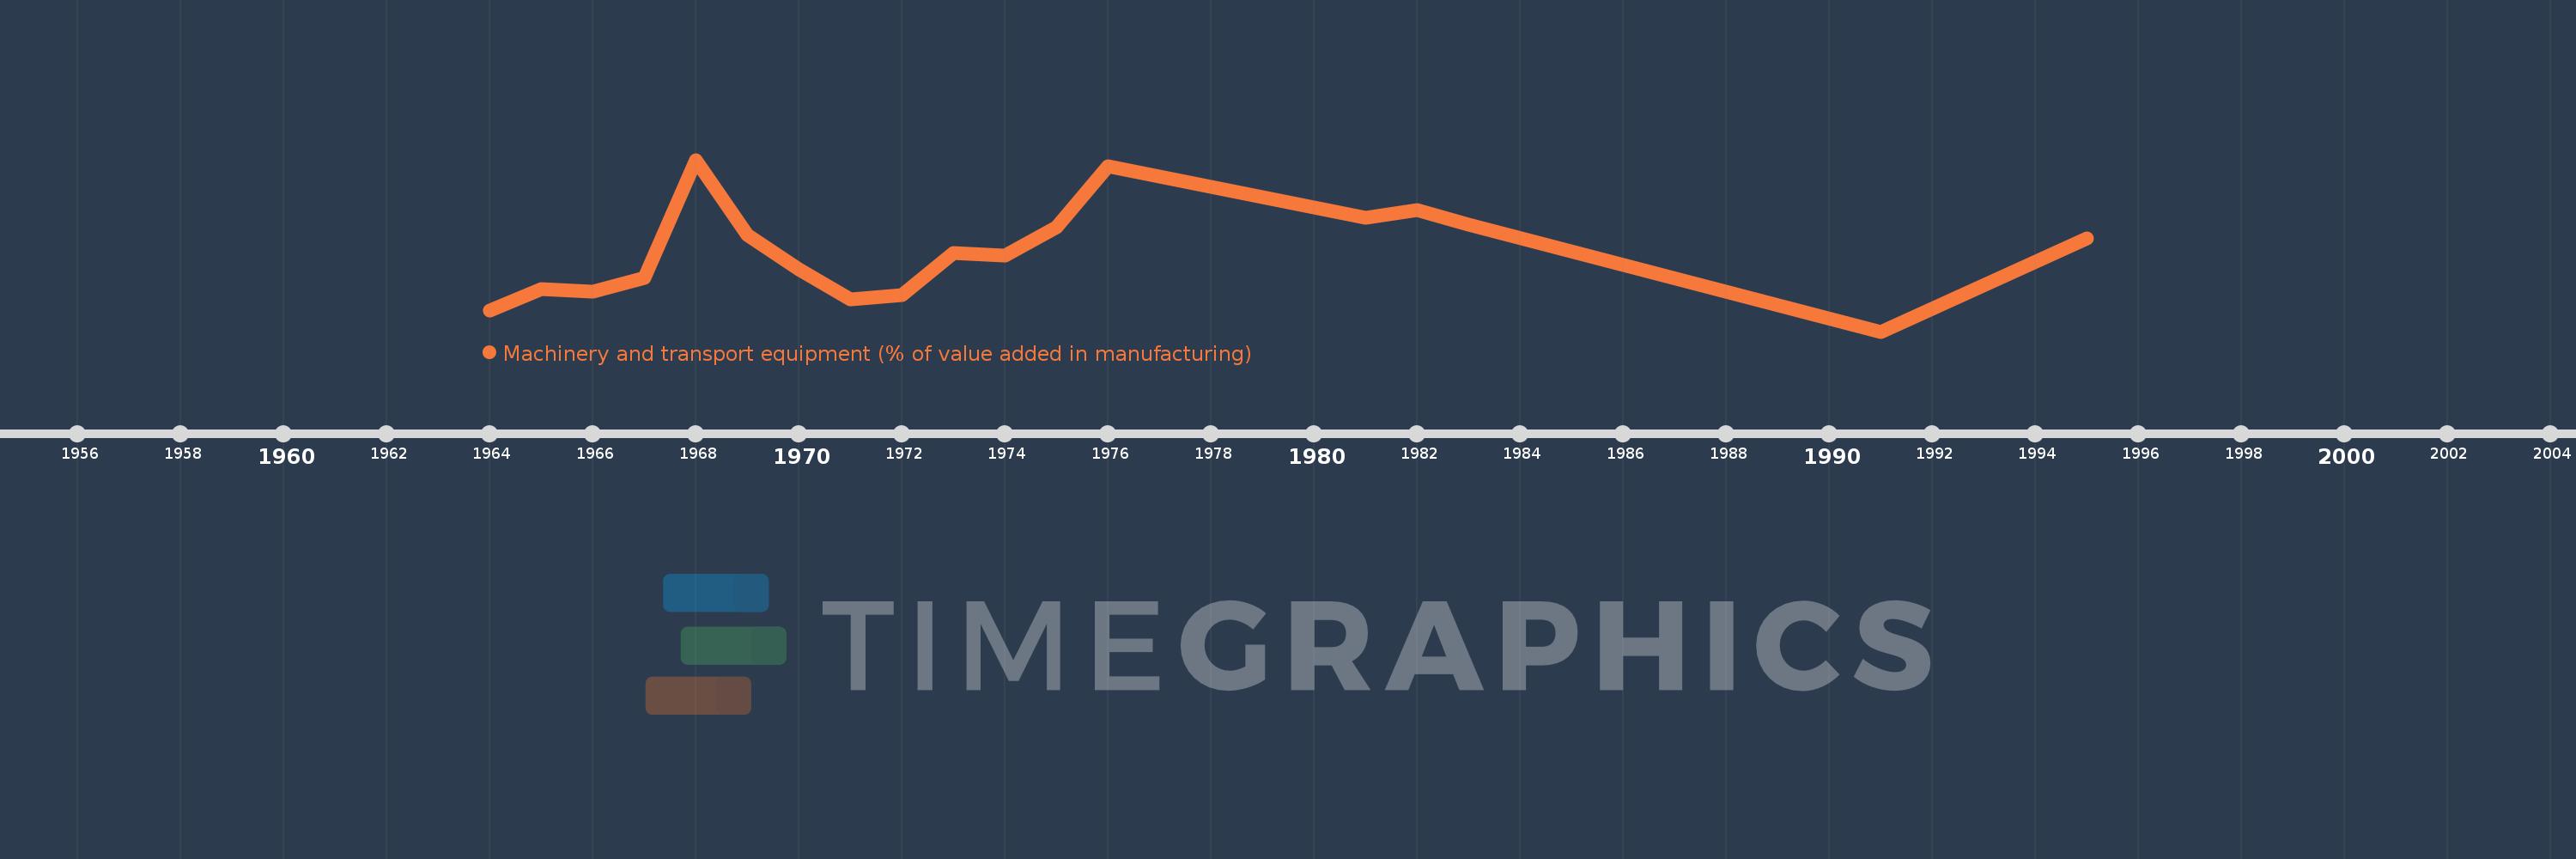
This timeline shows a graph from
1964
to
1995
of Zambia. No data until
1963
. Number of actual observations by date:
18
.
Source name:
World Development Indicators
Source organization:
United Nations Industrial Development Organization, International Yearbook of Industrial Statistics.
Categories, topics:
Economy & Growth
Last updated:
apr 23, 2017
Indicators value changes by year
Meaning:
4.83
Minimum:
2.443
jan 1, 1991
Maximum:
7.661
jan 1, 1968
At the date of observation
Value
Absolute change
Change from the previous value
jan 1, 1964
3.085
+3.085
0.0%
jan 1, 1965
3.735
+0.65
21.08%
jan 1, 1966
3.646
-0.089
-2.38%
jan 1, 1967
4.065
+0.419
11.5%
jan 1, 1968
7.661
+3.596
88.45%
jan 1, 1969
5.37
-2.291
-29.9%
jan 1, 1970
4.324
-1.046
-19.47%
jan 1, 1971
3.423
-0.901
-20.83%
jan 1, 1972
3.541
+0.117
3.43%
jan 1, 1973
4.835
+1.294
36.55%
jan 1, 1974
4.76
-0.075
-1.54%
jan 1, 1975
5.61
+0.85
17.85%
jan 1, 1976
7.456
+1.846
32.9%
jan 1, 1981
5.895
-1.561
-20.94%
jan 1, 1982
6.142
+0.247
4.19%
jan 1, 1983
5.688
-0.454
-7.39%
jan 1, 1991
2.443
-3.245
-57.05%
jan 1, 1995
5.268
+2.824
115.6%
Ranking of countries by current statistics by years
About & Feedback
Terms
Privacy
FAQ
Support 24/7
Cabinet
Get premium
Donate
The service accepts bank transfer (ACH, Wire) or cards (Visa, MasterCard, etc). Processed by Stripe.
Secured with SSL