33
/
AIzaSyB4mHJ5NPEv-XzF7P6NDYXjlkCWaeKw5bc
November 30, 2025
221100
Paraguay
PRY
true
2
1
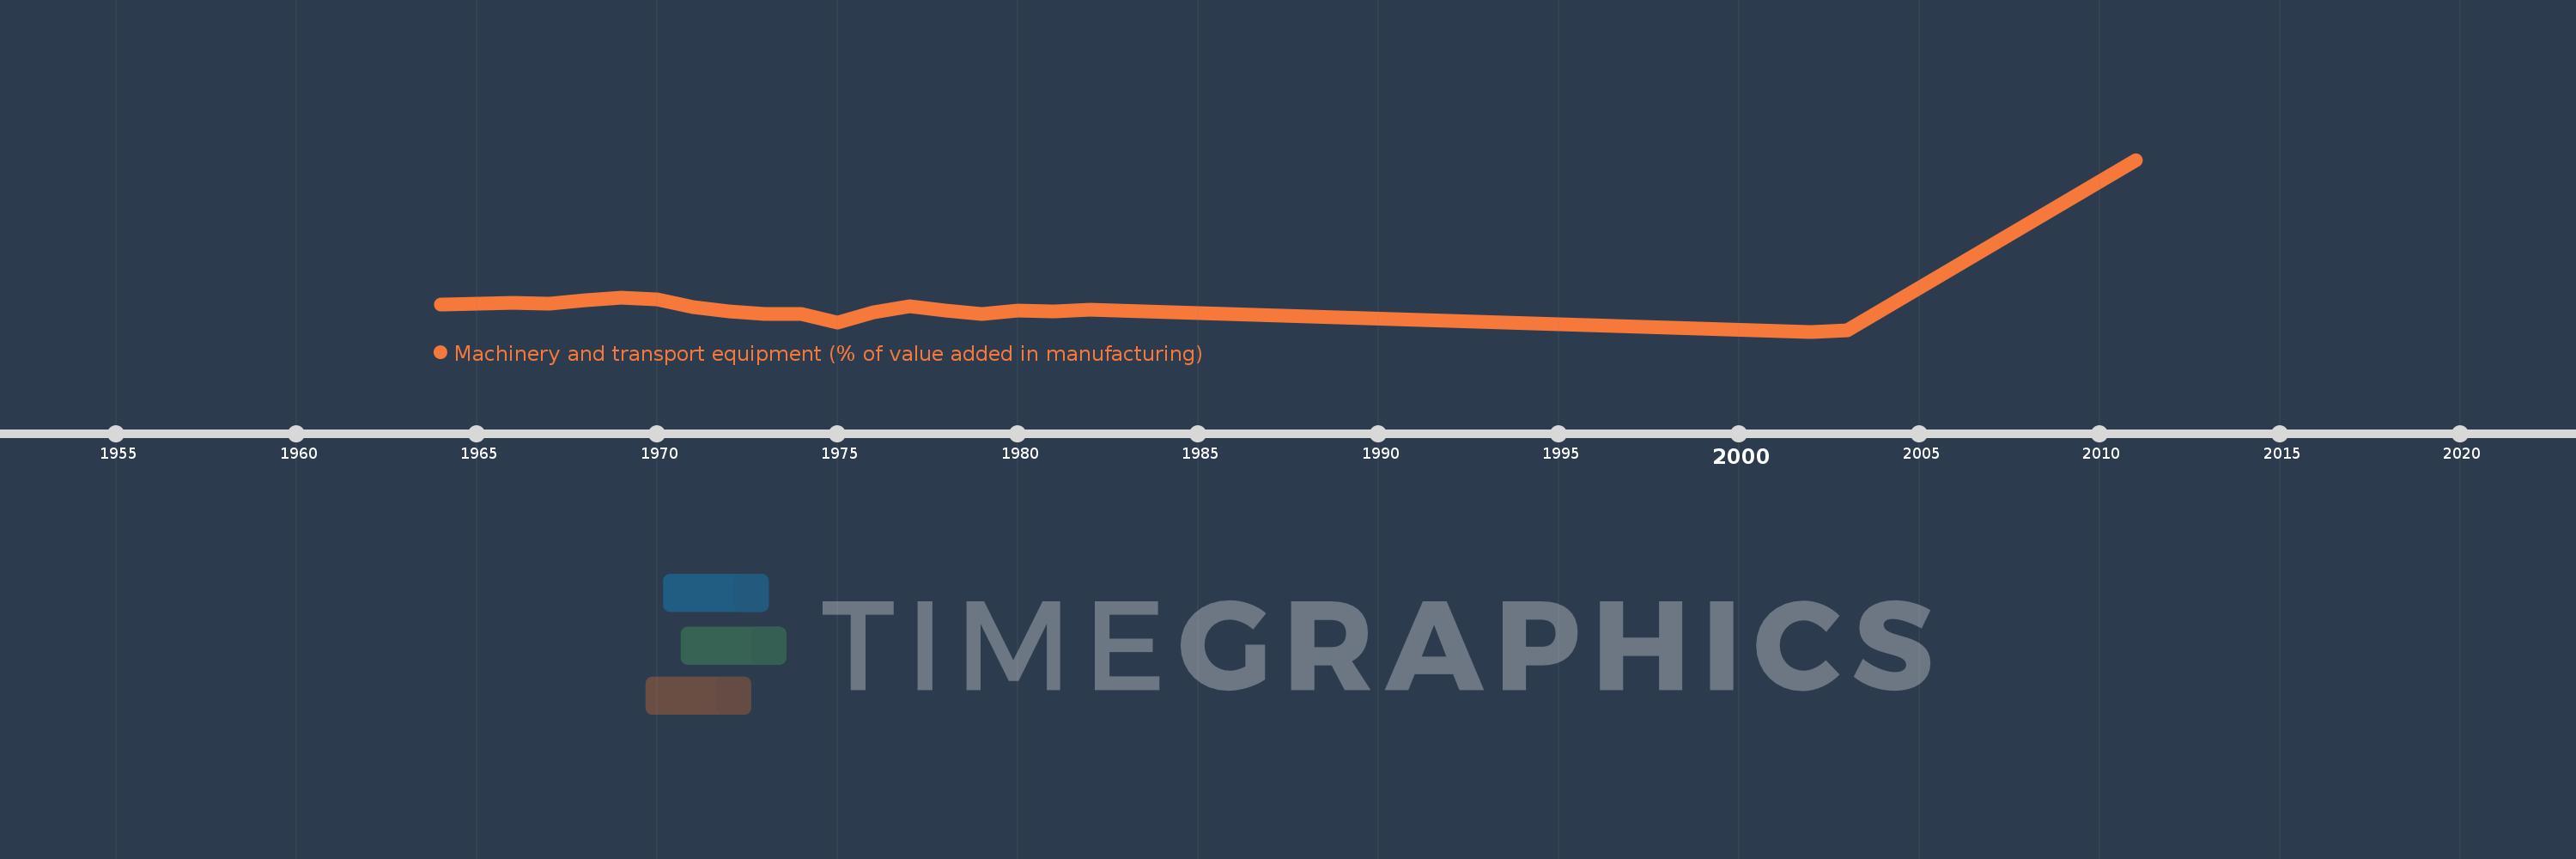
Machinery and transport equipment (% of value added in manufacturing)
2011,2003,2002,1982,1981,1980,1979,1978,1977,1976,1975,1974,1973,1972,1971,1970,1969,1968,1967,1966,1965,1964