33
/
AIzaSyB4mHJ5NPEv-XzF7P6NDYXjlkCWaeKw5bc
November 30, 2025
113838
Cote d'Ivoire
CIV
true
2
1
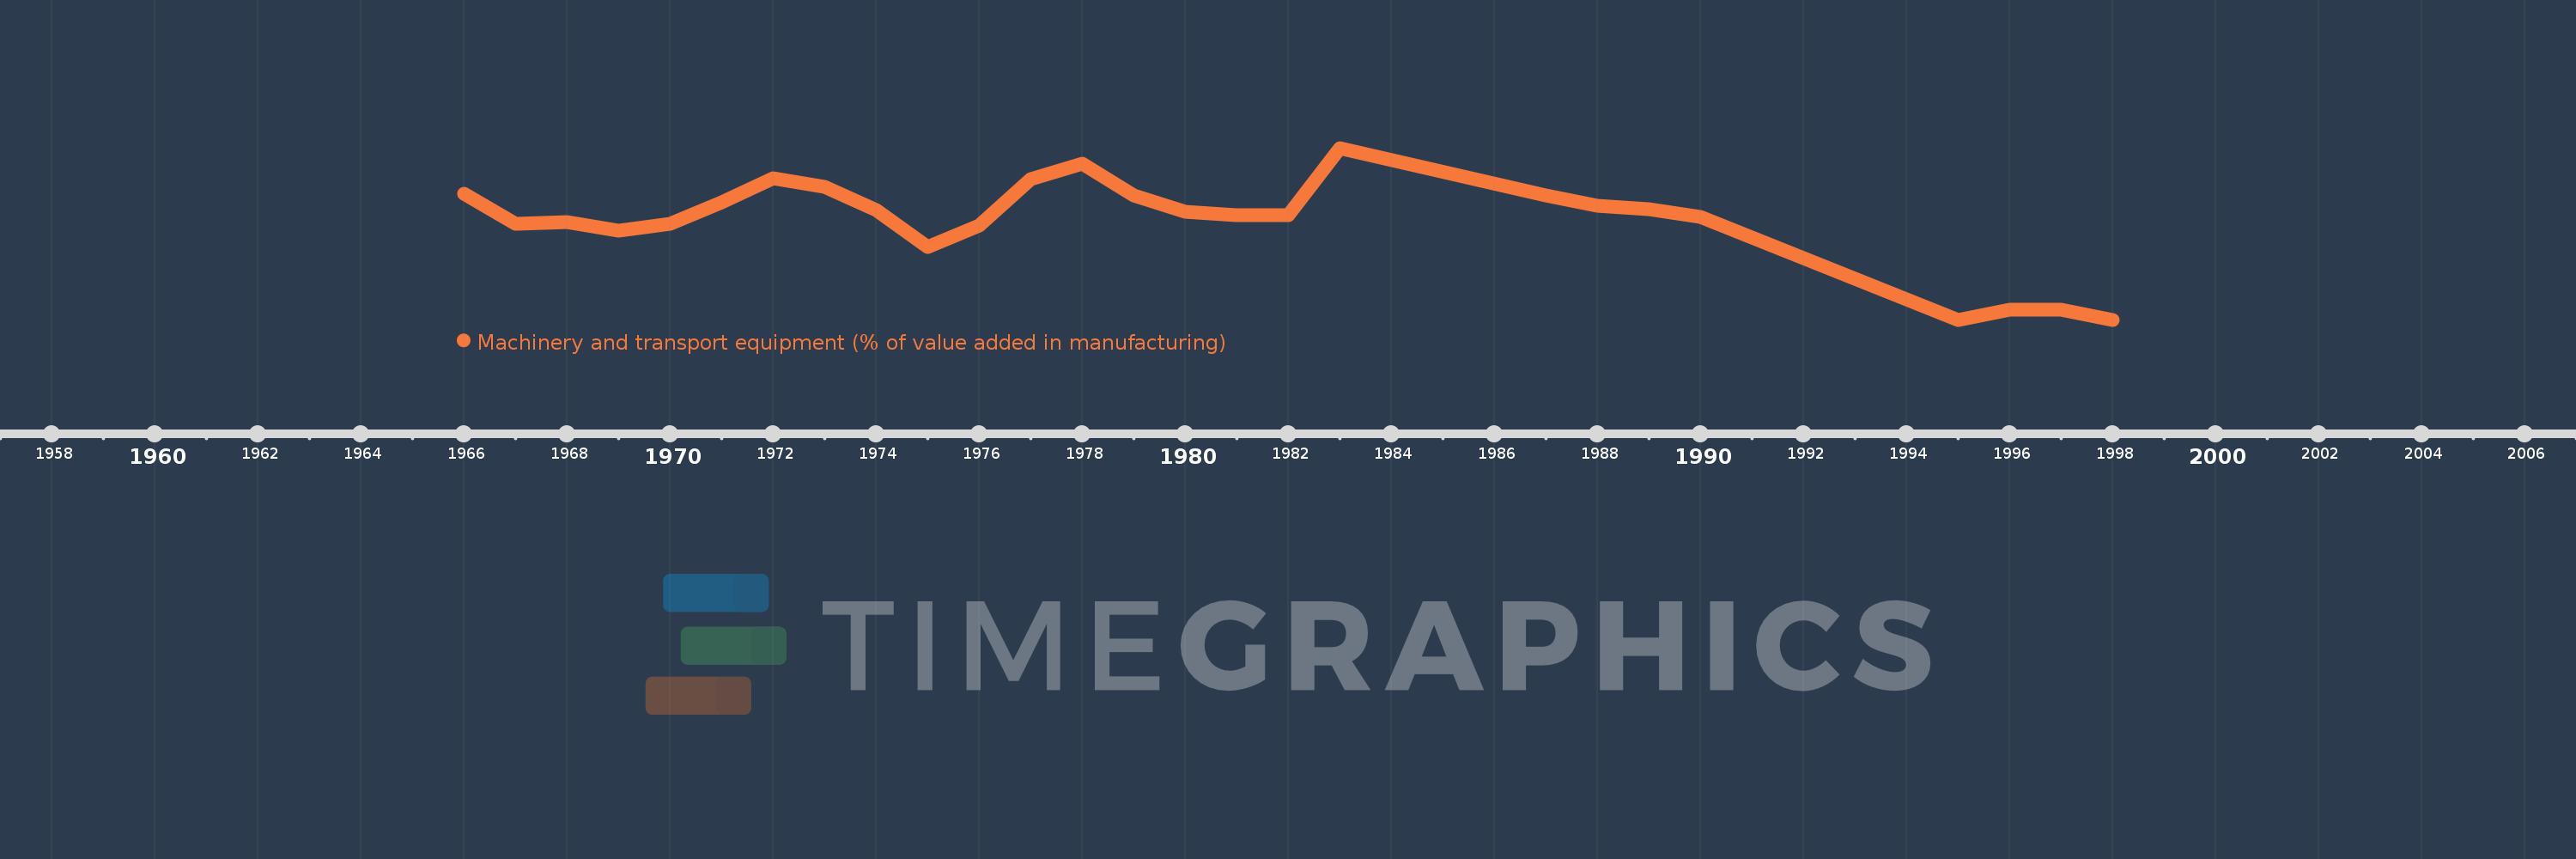
Machinery and transport equipment (% of value added in manufacturing)
1998,1997,1996,1995,1990,1989,1988,1987,1983,1982,1981,1980,1979,1978,1977,1976,1975,1974,1973,1972,1971,1970,1969,1968,1967,1966