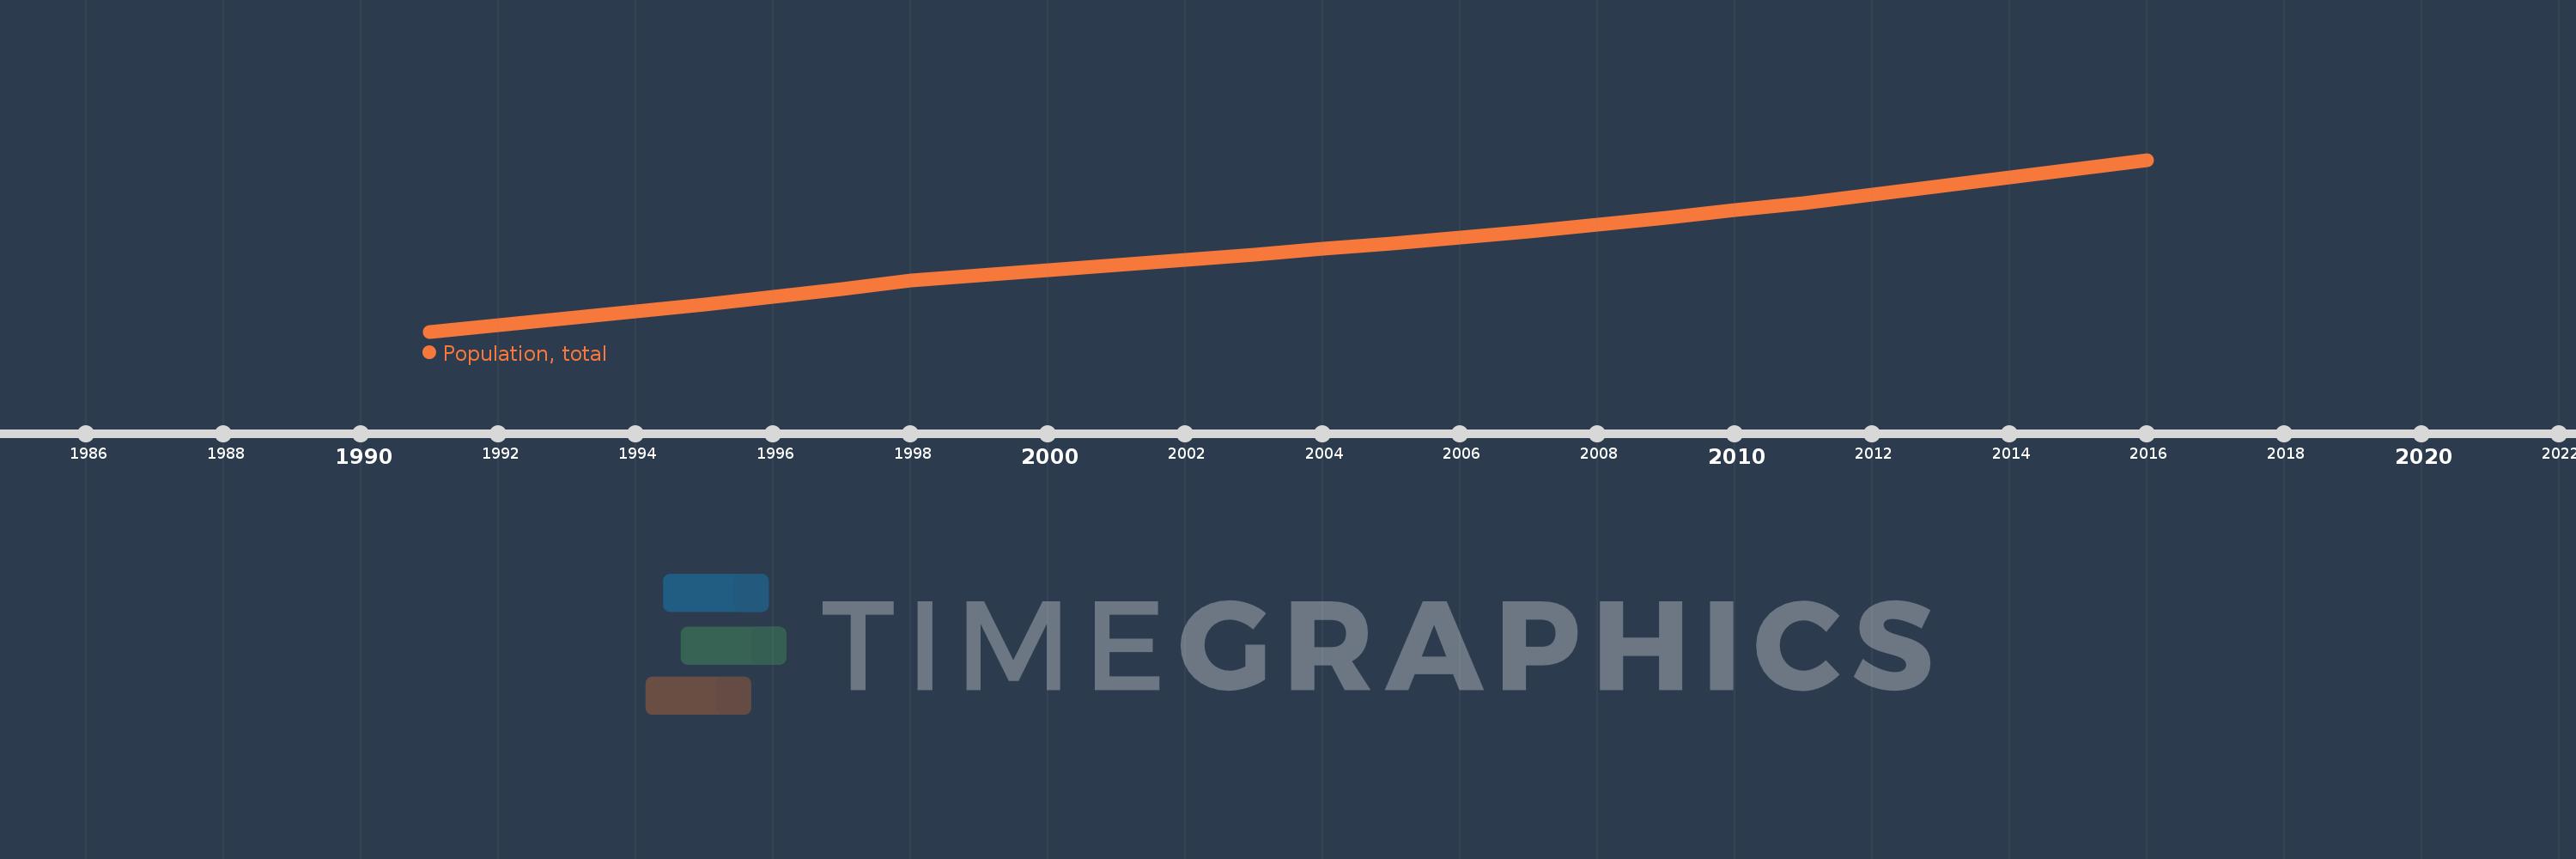
This timeline shows a graph from 1991 to 2016 of West Bank and Gaza. No data until 1990. Number of actual observations by date: 26.
Source name:
World Development Indicators
Source organization:
(1) United Nations Population Division. World Population Prospects, (2) Census reports and other statistical publications from national statistical offices, (3) Eurostat: Demographic Statistics, (4) United Nations Statistical Division. Population and Vital Statistics Report (various years), (5) U.S. Census Bureau: International Database, and (6) Secretariat of the Pacific Community: Statistics and Demography Programme.
Categories, topics:
Climate Change, Health
Last updated:
apr 23, 2017
Indicators value changes by year
Meaning:
3.147 mln
Minimum:
1.978 mln
jan 1, 1991
Maximum:
4.422 mln
jan 1, 2016
At the date of observation
Value
Absolute change
Change from the previous value
jan 1, 1991
1.978 mln
+1.978 mln
0.0%
jan 1, 1992
2.069 mln
+90.597K
4.58%
jan 1, 1993
2.164 mln
+94.746K
4.58%
jan 1, 1994
2.263 mln
+99.085K
4.58%
jan 1, 1995
2.366 mln
+103.622K
4.58%
jan 1, 1996
2.475 mln
+108.368K
4.58%
jan 1, 1997
2.588 mln
+113.331K
4.58%
jan 1, 1998
2.707 mln
+118.521K
4.58%
jan 1, 1999
2.777 mln
+70.05K
2.59%
jan 1, 2000
2.848 mln
+71.863K
2.59%
jan 1, 2001
2.922 mln
+73.722K
2.59%
jan 1, 2002
2.998 mln
+75.631K
2.59%
jan 1, 2003
3.075 mln
+77.589K
2.59%
jan 1, 2004
3.155 mln
+79.596K
2.59%
jan 1, 2005
3.237 mln
+81.657K
2.59%
jan 1, 2006
3.32 mln
+83.77K
2.59%
jan 1, 2007
3.406 mln
+85.938K
2.59%
jan 1, 2008
3.494 mln
+88.162K
2.59%
jan 1, 2009
3.597 mln
+102.192K
2.92%
jan 1, 2010
3.702 mln
+105.53K
2.93%
jan 1, 2011
3.811 mln
+108.884K
2.94%
jan 1, 2012
3.927 mln
+115.949K
3.04%
jan 1, 2013
4.047 mln
+119.85K
3.05%
jan 1, 2014
4.17 mln
+122.605K
3.03%
jan 1, 2015
4.295 mln
+125.176K
3.0%
jan 1, 2016
4.422 mln
+127.461K
2.97%
Ranking of countries by current statistics by years