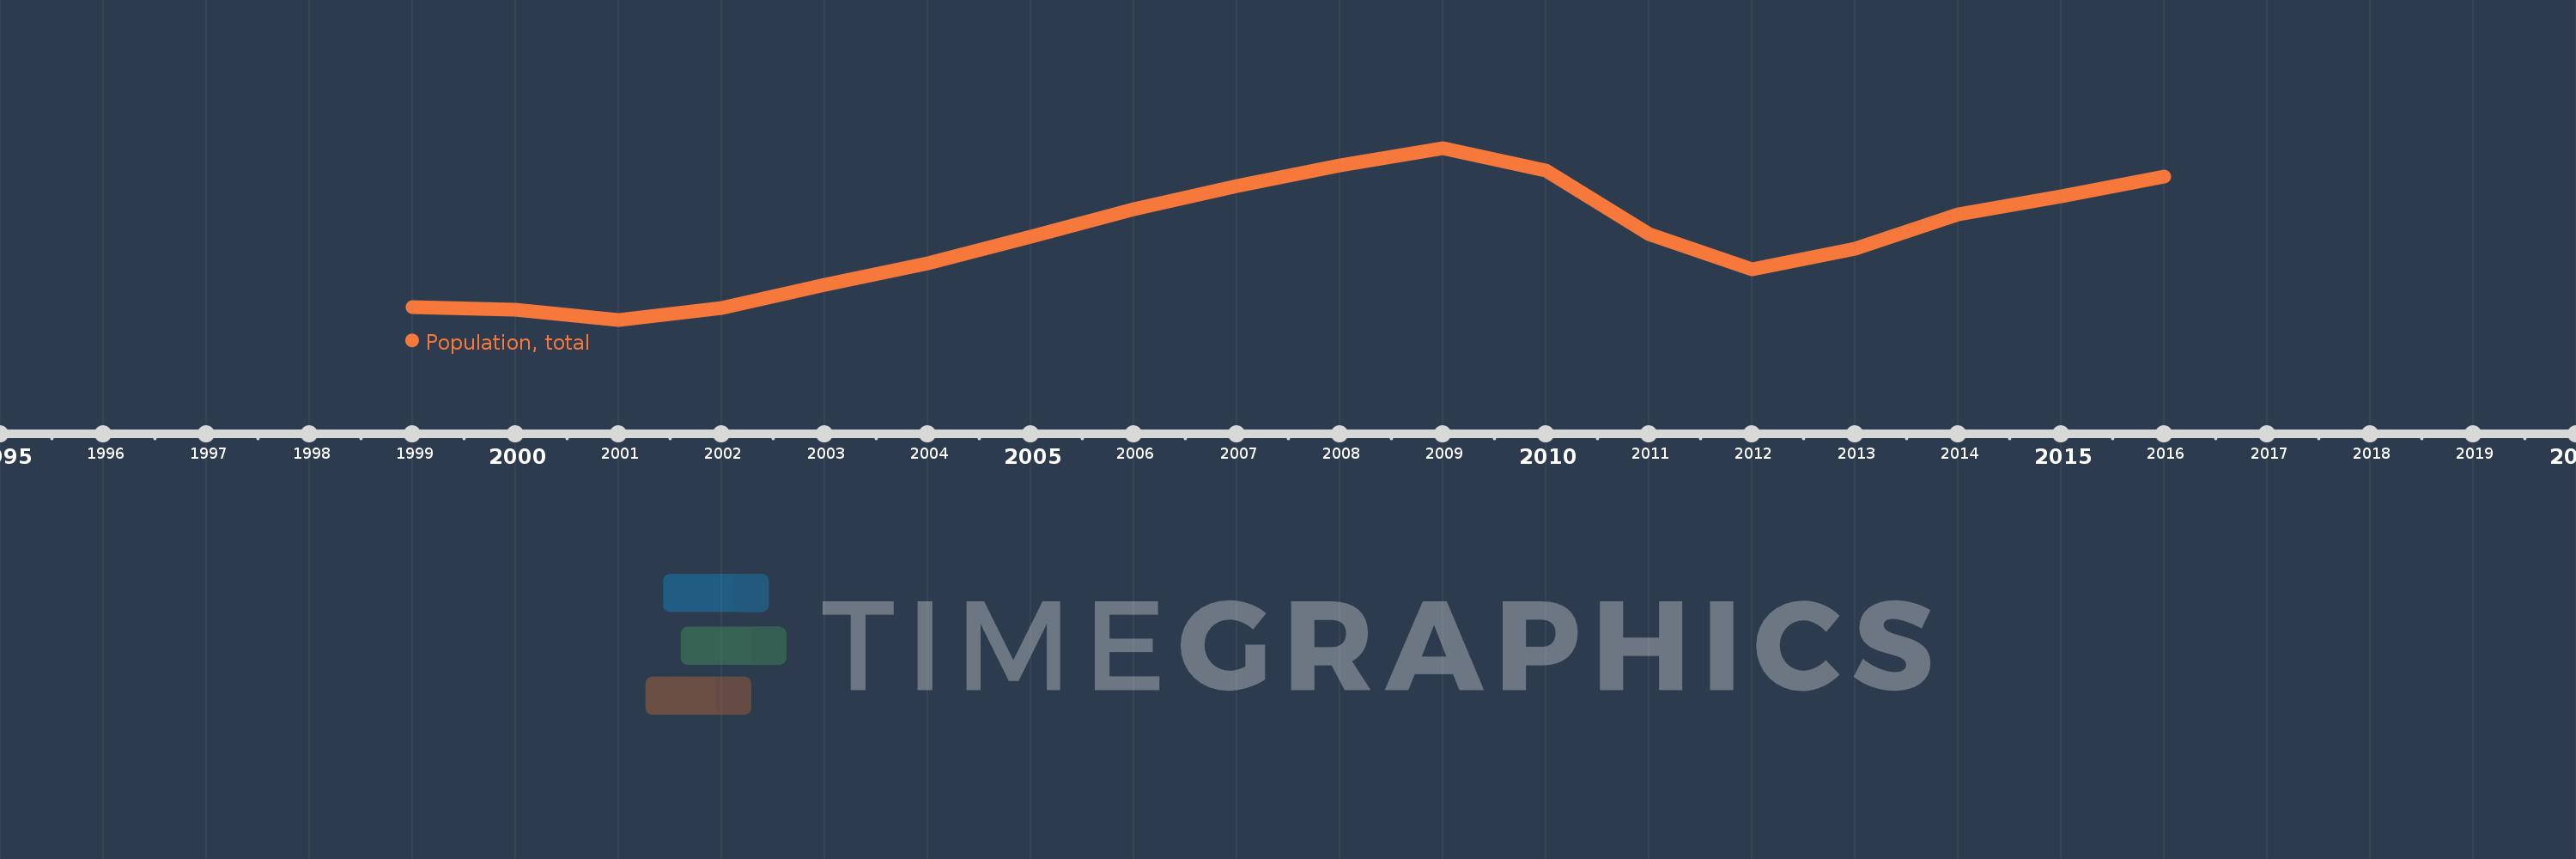
This timeline shows a graph from 1999 to 2016 of Sint Maarten (Dutch part). No data until 1998. Number of actual observations by date: 18.
Source name:
World Development Indicators
Source organization:
(1) United Nations Population Division. World Population Prospects, (2) Census reports and other statistical publications from national statistical offices, (3) Eurostat: Demographic Statistics, (4) United Nations Statistical Division. Population and Vital Statistics Report (various years), (5) U.S. Census Bureau: International Database, and (6) Secretariat of the Pacific Community: Statistics and Demography Programme.
Categories, topics:
Climate Change, Health
Last updated:
apr 23, 2017
Indicators value changes by year
Meaning:
35.368K
Minimum:
30.519K
jan 1, 2001
Maximum:
40.458K
jan 1, 2009
At the date of observation
Value
Absolute change
Change from the previous value
jan 1, 1999
31.24K
+31.24K
0.0%
jan 1, 2000
31.084K
-156.0
-0.5%
jan 1, 2001
30.519K
-565.0
-1.82%
jan 1, 2002
31.189K
+670.0
2.2%
jan 1, 2003
32.566K
+1.377K
4.42%
jan 1, 2004
33.79K
+1.224K
3.76%
jan 1, 2005
35.316K
+1.526K
4.52%
jan 1, 2006
36.934K
+1.618K
4.58%
jan 1, 2007
38.27K
+1.336K
3.62%
jan 1, 2008
39.462K
+1.192K
3.11%
jan 1, 2009
40.458K
+996.0
2.52%
jan 1, 2010
39.133K
-1.325K
-3.28%
jan 1, 2011
35.474K
-3.659K
-9.35%
jan 1, 2012
33.435K
-2.039K
-5.75%
jan 1, 2013
34.64K
+1.205K
3.6%
jan 1, 2014
36.607K
+1.967K
5.68%
jan 1, 2015
37.685K
+1.078K
2.94%
jan 1, 2016
38.817K
+1.132K
3.0%
Ranking of countries by current statistics by years