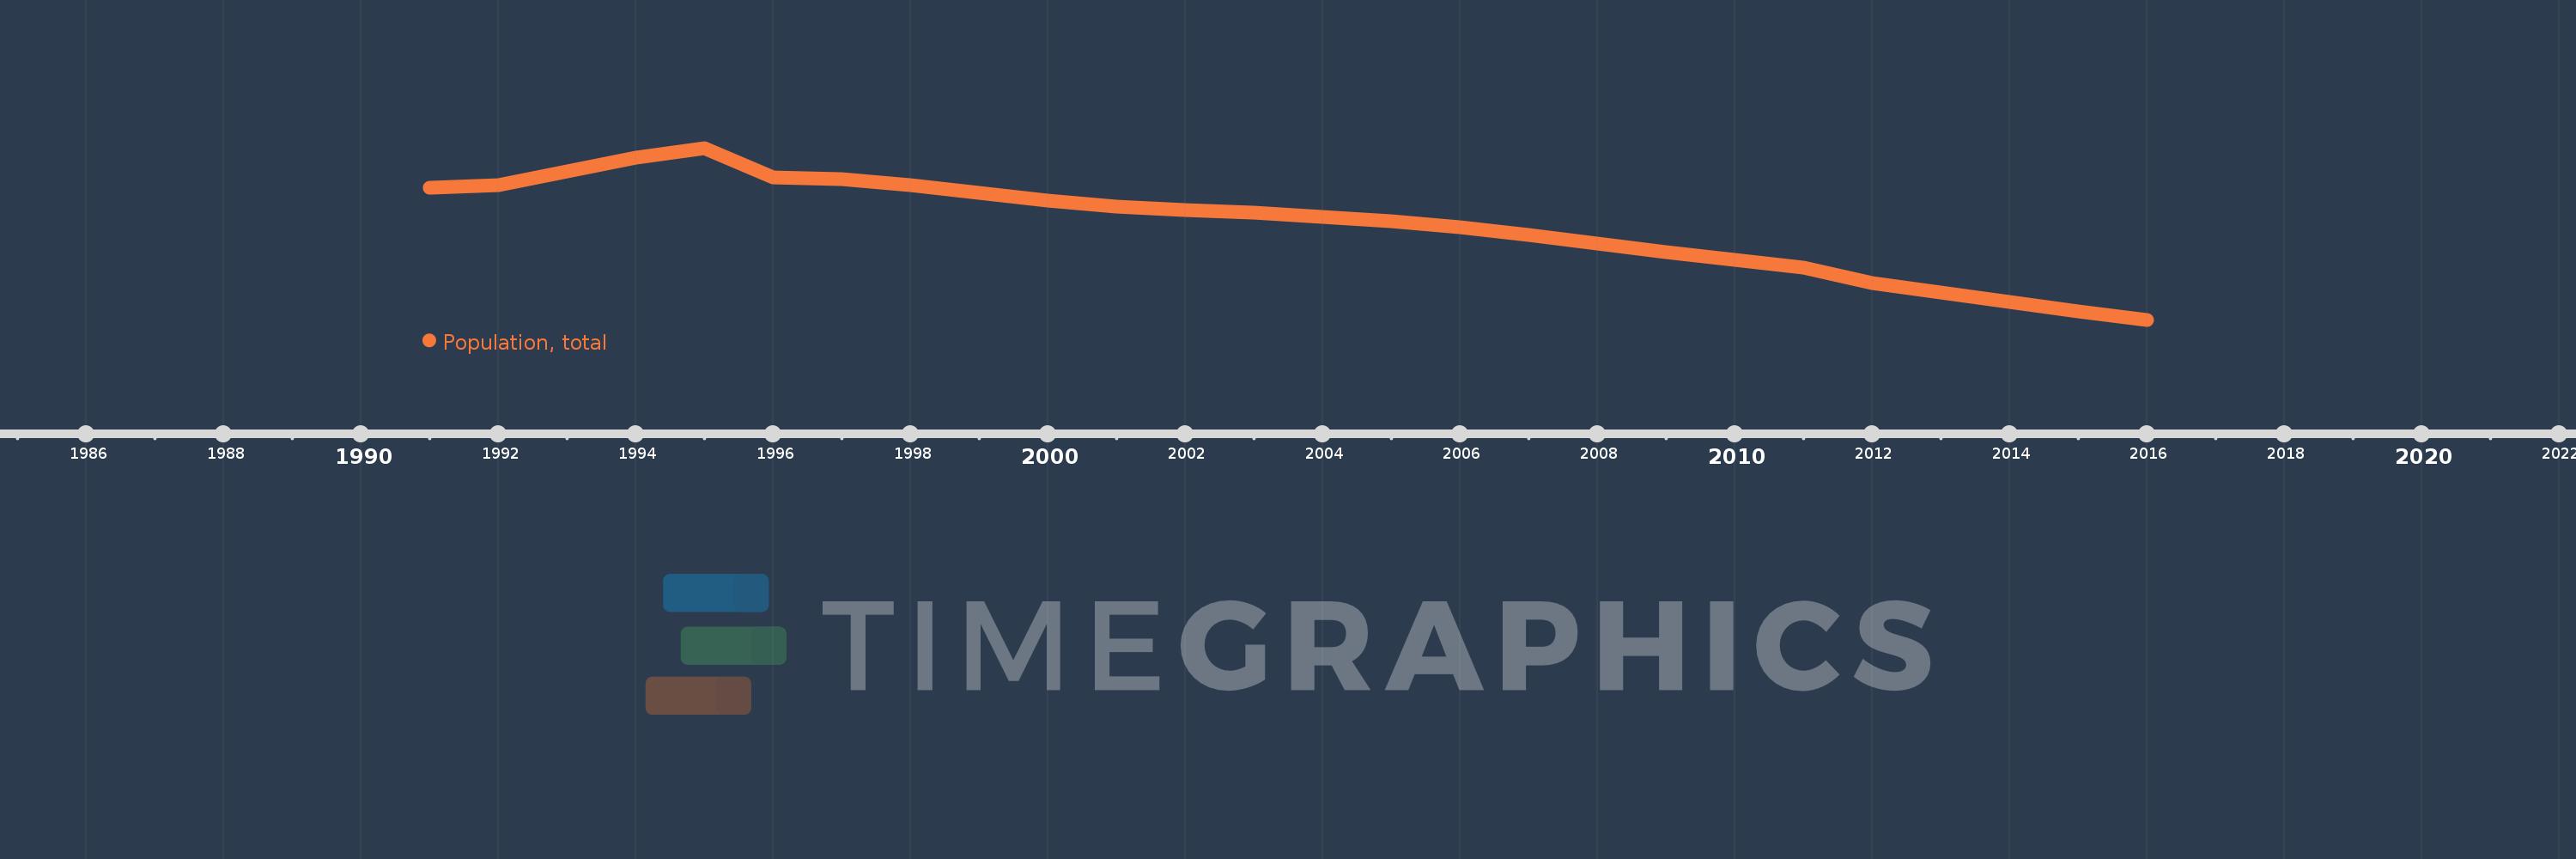
This timeline shows a graph from 1991 to 2016 of Serbia. No data until 1990. Number of actual observations by date: 26.
Source name:
World Development Indicators
Source organization:
(1) United Nations Population Division. World Population Prospects, (2) Census reports and other statistical publications from national statistical offices, (3) Eurostat: Demographic Statistics, (4) United Nations Statistical Division. Population and Vital Statistics Report (various years), (5) U.S. Census Bureau: International Database, and (6) Secretariat of the Pacific Community: Statistics and Demography Programme.
Categories, topics:
Climate Change, Health
Last updated:
apr 23, 2017
Indicators value changes by year
Meaning:
7.45 mln
Minimum:
7.098 mln
jan 1, 2016
Maximum:
7.735 mln
jan 1, 1995
At the date of observation
Value
Absolute change
Change from the previous value
jan 1, 1991
7.586 mln
+7.586 mln
0.0%
jan 1, 1992
7.596 mln
+9.636K
0.13%
jan 1, 1993
7.646 mln
+50.788K
0.67%
jan 1, 1994
7.699 mln
+52.883K
0.69%
jan 1, 1995
7.735 mln
+35.332K
0.46%
jan 1, 1996
7.625 mln
-109.282K
-1.41%
jan 1, 1997
7.618 mln
-7.563K
-0.1%
jan 1, 1998
7.597 mln
-21.293K
-0.28%
jan 1, 1999
7.568 mln
-28.756K
-0.38%
jan 1, 2000
7.54 mln
-27.344K
-0.36%
jan 1, 2001
7.516 mln
-24.055K
-0.32%
jan 1, 2002
7.503 mln
-12.913K
-0.17%
jan 1, 2003
7.497 mln
-6.911K
-0.09%
jan 1, 2004
7.481 mln
-15.931K
-0.21%
jan 1, 2005
7.463 mln
-17.434K
-0.23%
jan 1, 2006
7.441 mln
-22.388K
-0.3%
jan 1, 2007
7.412 mln
-29.2K
-0.39%
jan 1, 2008
7.382 mln
-29.99K
-0.4%
jan 1, 2009
7.35 mln
-31.357K
-0.42%
jan 1, 2010
7.321 mln
-29.415K
-0.4%
jan 1, 2011
7.291 mln
-29.371K
-0.4%
jan 1, 2012
7.234 mln
-57.337K
-0.79%
jan 1, 2013
7.199 mln
-35.022K
-0.48%
jan 1, 2014
7.164 mln
-34.945K
-0.49%
jan 1, 2015
7.131 mln
-33.556K
-0.47%
jan 1, 2016
7.098 mln
-32.329K
-0.45%
Ranking of countries by current statistics by years