Download This statistics in other country:
Timeline:
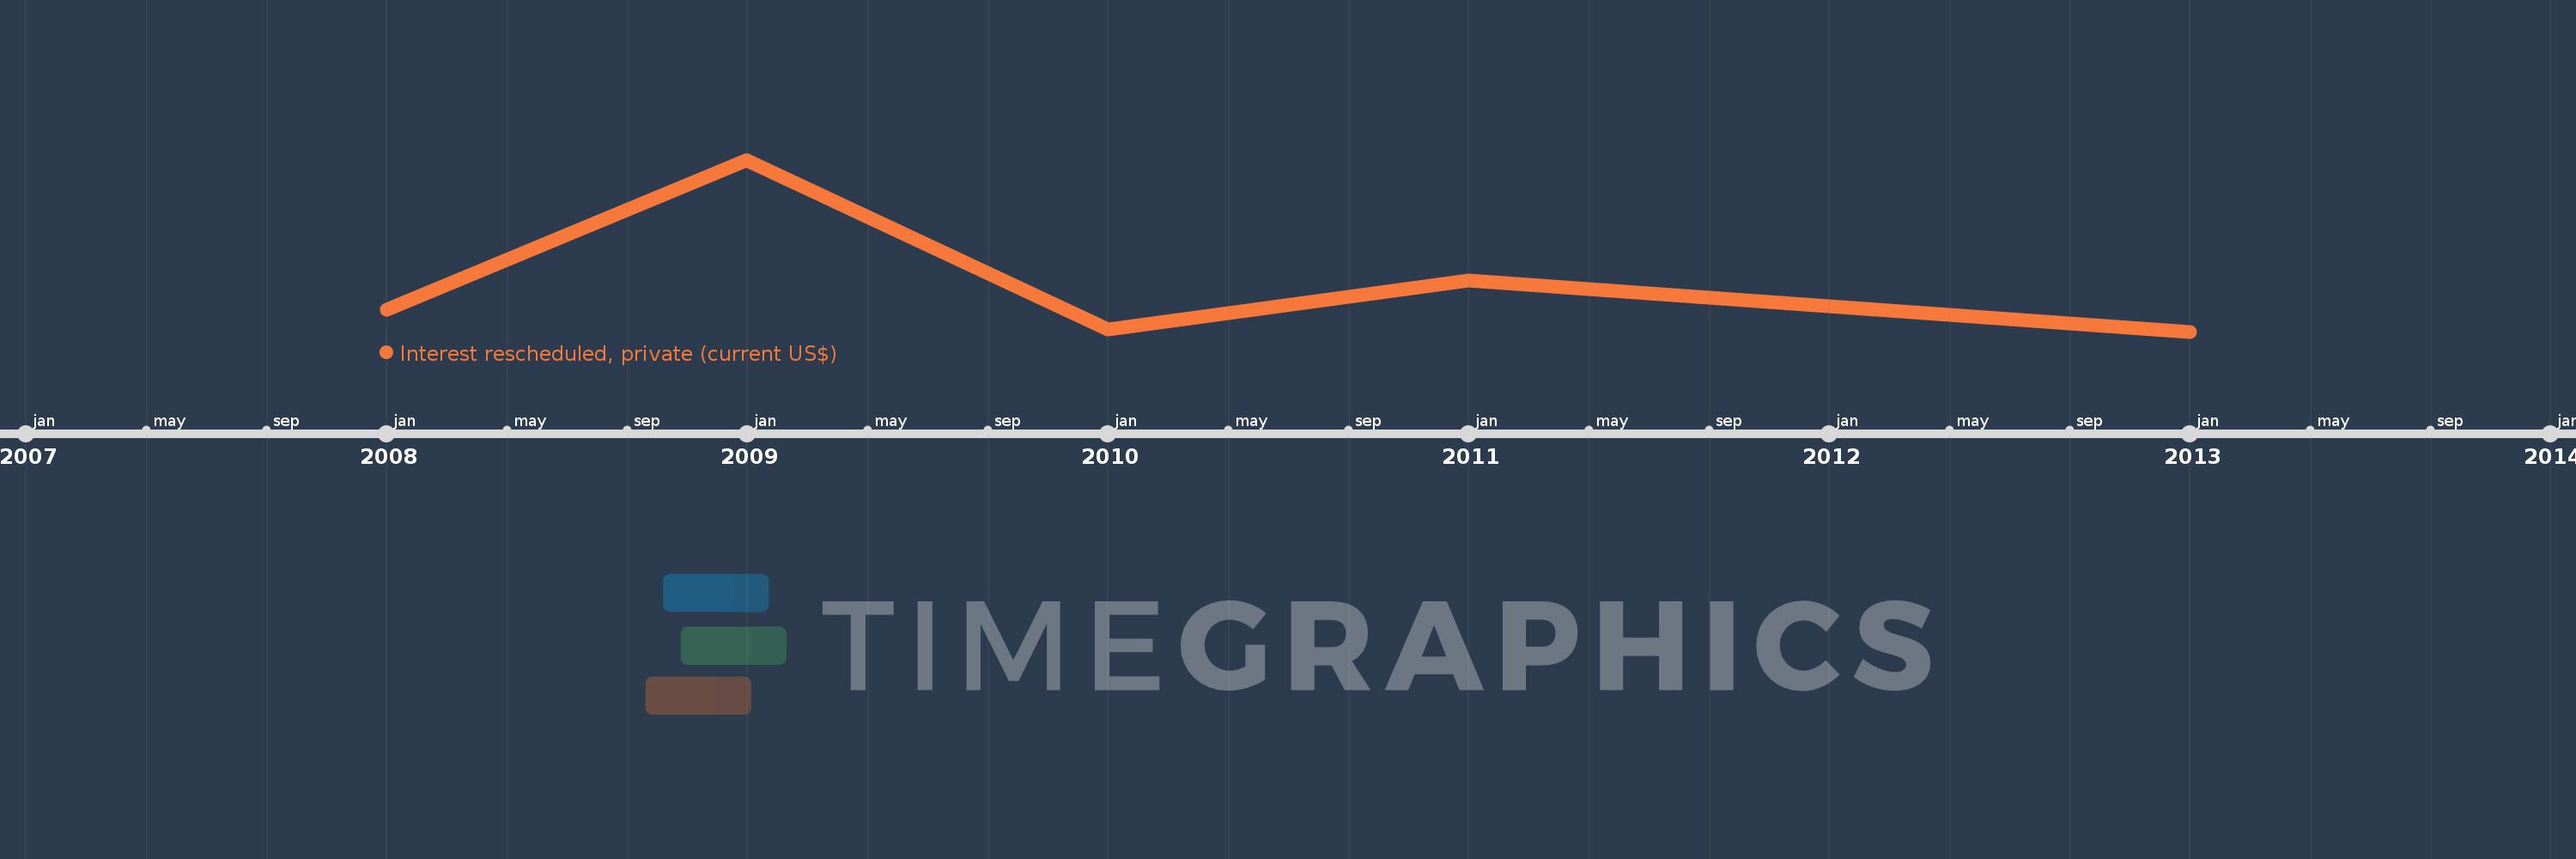
This timeline shows a graph from 2008 to 2013 of Uzbekistan. No data until 2007. Number of actual observations by date: 5.
Source name:
World Development Indicators
Source organization:
World Bank, International Debt Statistics.
Categories, topics:
External Debt
Last updated:
apr 23, 2017
Indicators value changes by year
Maximum:
30.063 mln
jan 1, 2009
At the date of observation
Value
Absolute change
Change from the previous value
jan 1, 2008
3.897 mln
+3.897 mln
0.0%
jan 1, 2009
30.063 mln
+26.166 mln
671.44%
jan 1, 2010
497.0K
-29.566 mln
-98.35%
jan 1, 2011
9.062 mln
+8.565 mln
1.72K%
jan 1, 2013
80.0K
-8.982 mln
-99.12%
Ranking of countries by current statistics by years