Download This statistics in other country:
Timeline:
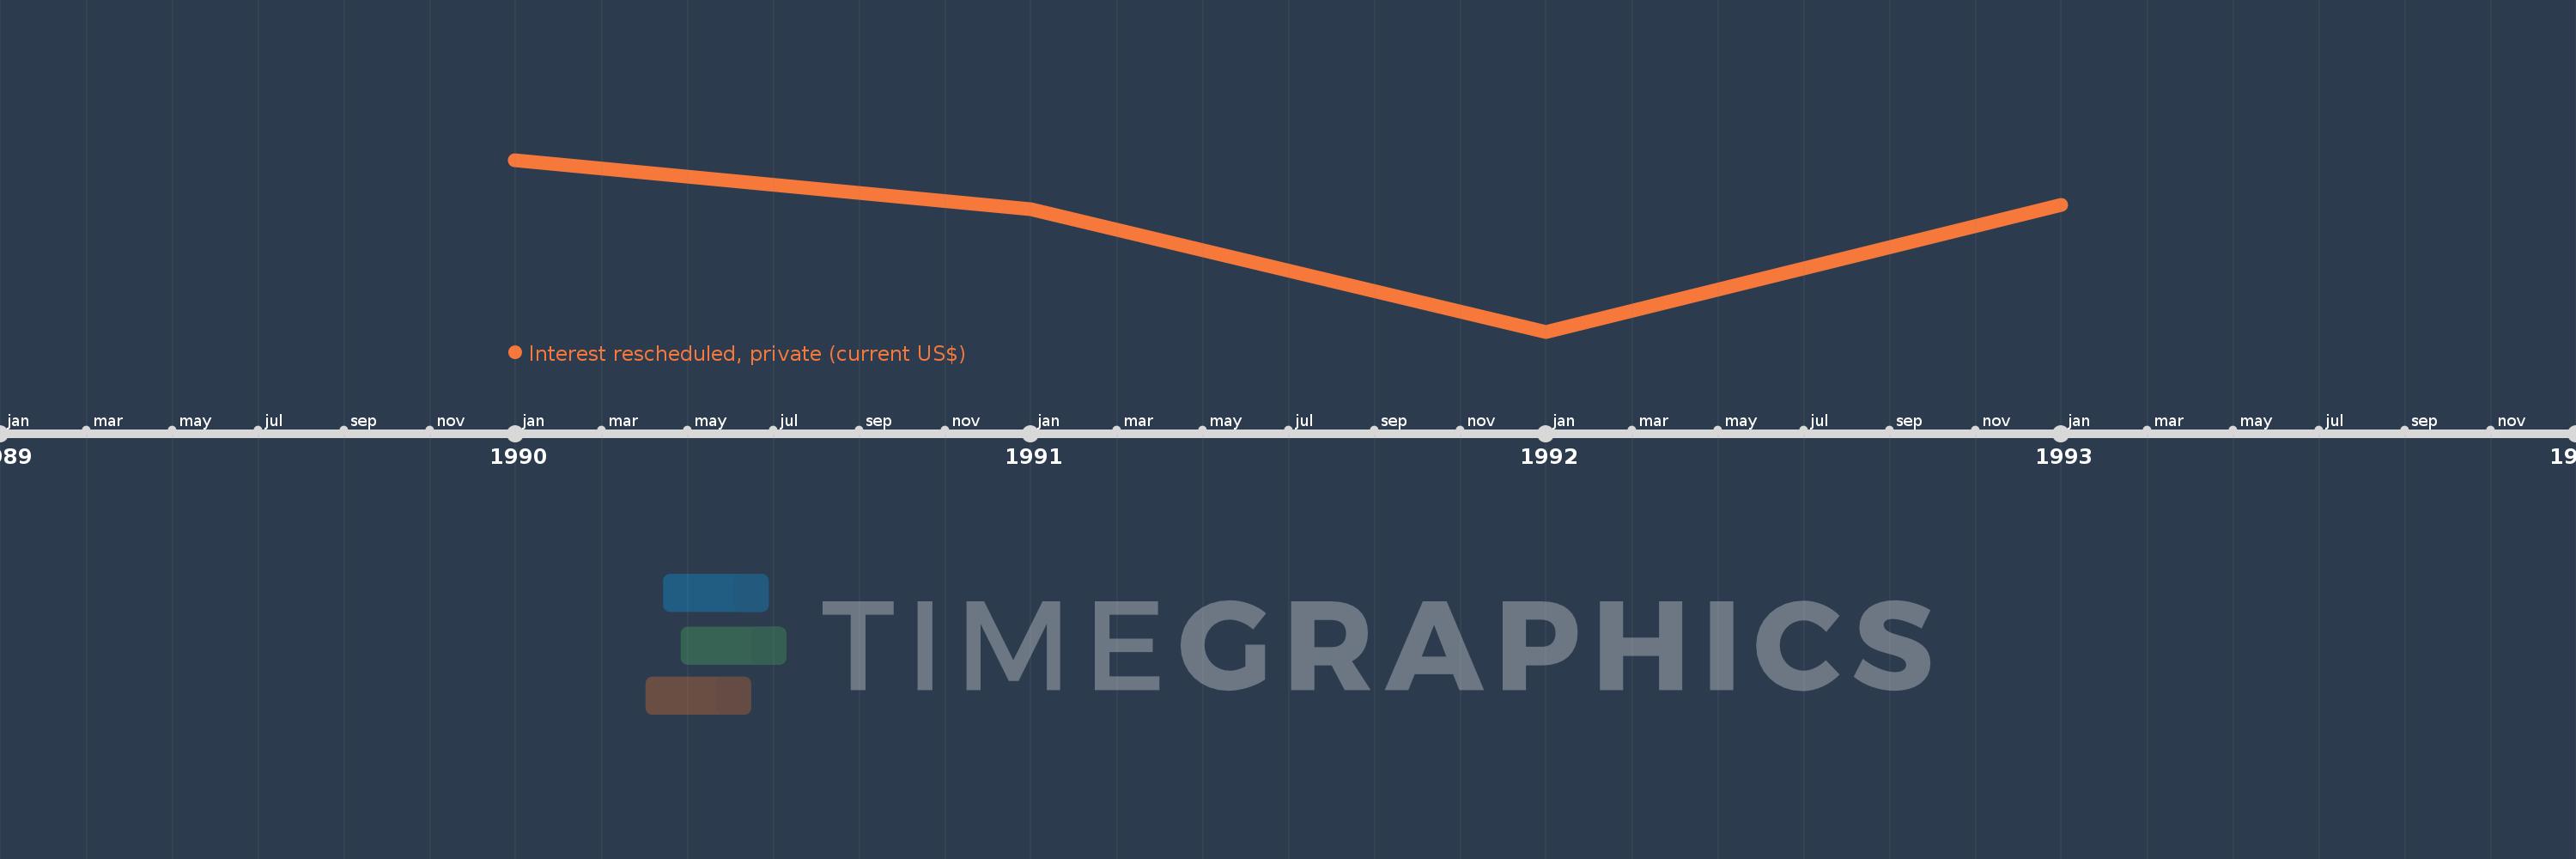
This timeline shows a graph from 1990 to 1993 of Morocco. No data until 1989. Number of actual observations by date: 4.
Source name:
World Development Indicators
Source organization:
World Bank, International Debt Statistics.
Categories, topics:
External Debt
Last updated:
apr 23, 2017
Indicators value changes by year
Minimum:
29.765 mln
jan 1, 1992
Maximum:
102.392 mln
jan 1, 1990
At the date of observation
Value
Absolute change
Change from the previous value
jan 1, 1990
102.392 mln
+102.392 mln
0.0%
jan 1, 1991
81.566 mln
-20.826 mln
-20.34%
jan 1, 1992
29.765 mln
-51.801 mln
-63.51%
jan 1, 1993
83.411 mln
+53.646 mln
180.23%
Ranking of countries by current statistics by years