Download This statistics in other country:
Timeline:
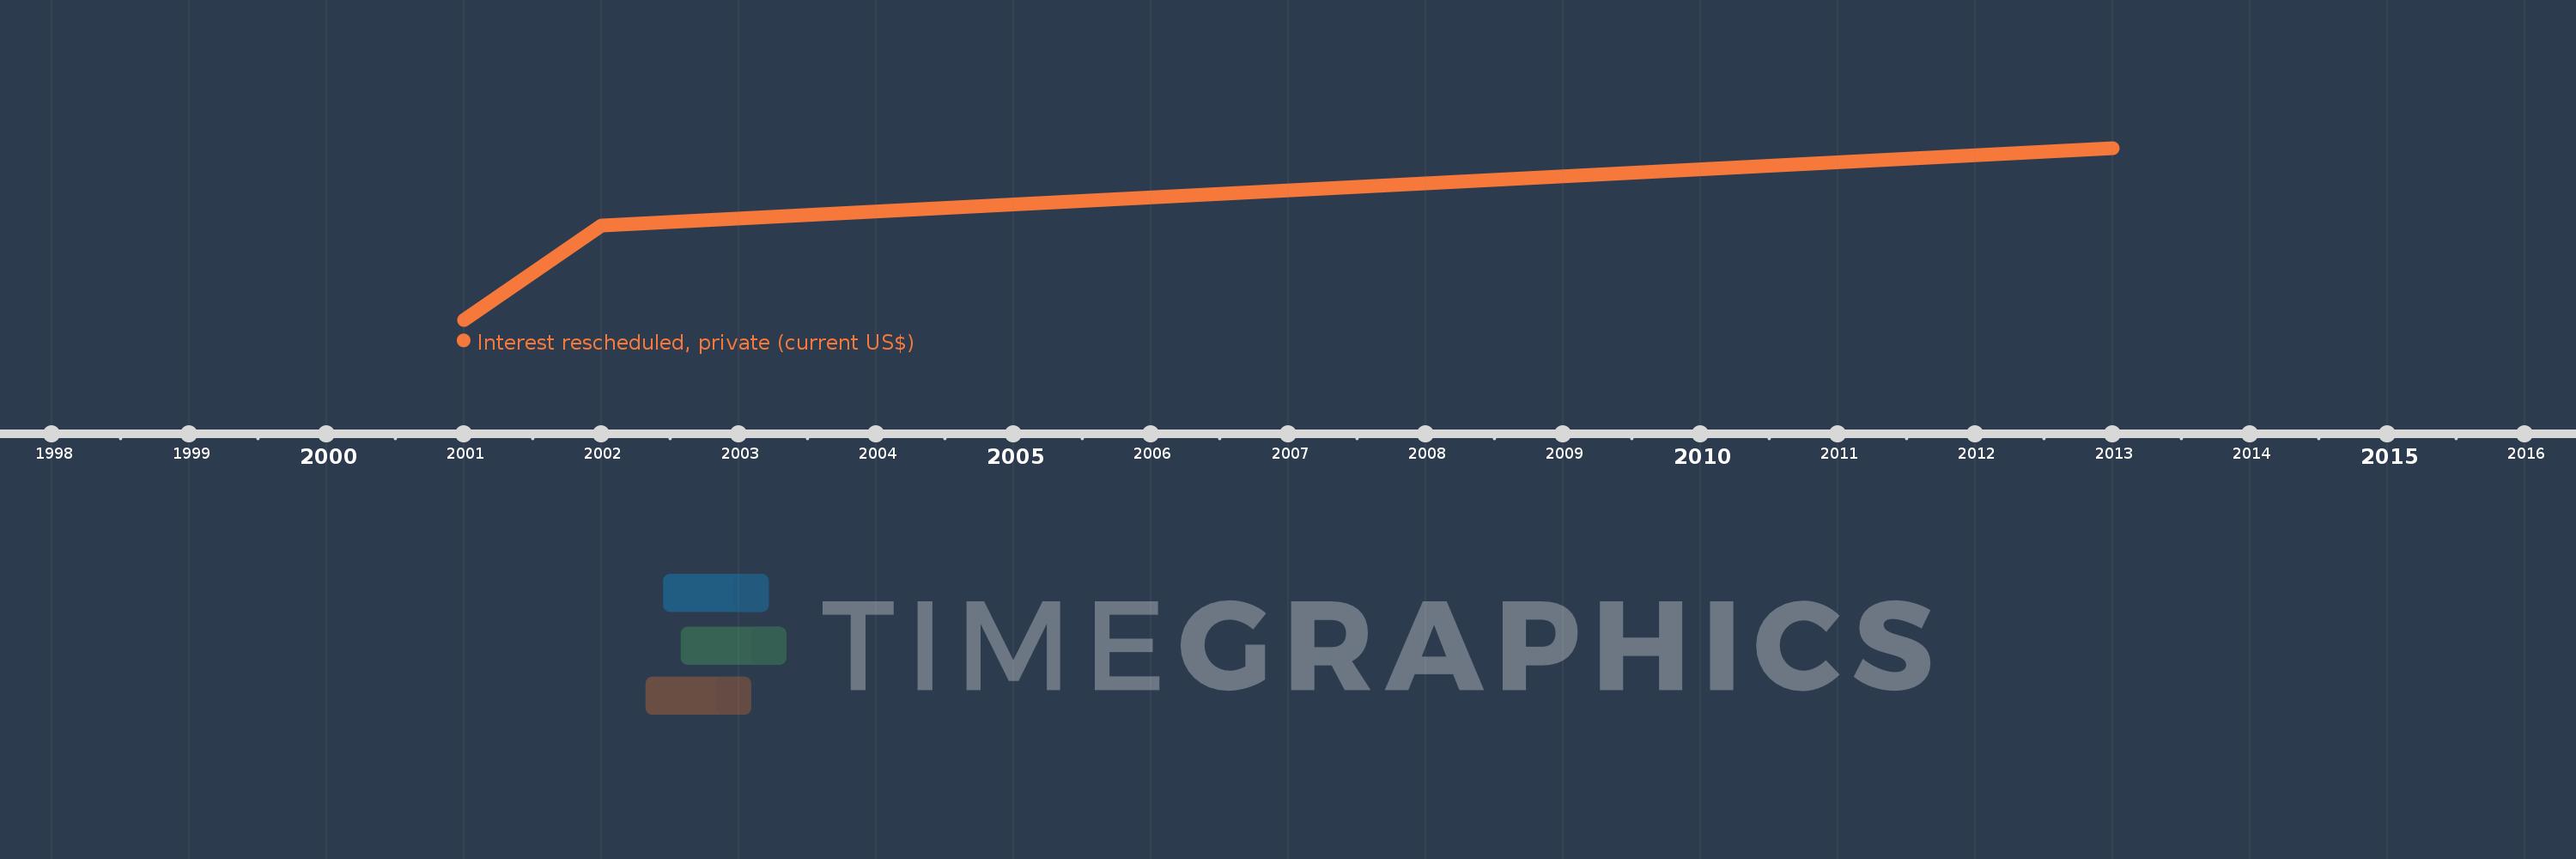
This timeline shows a graph from 2001 to 2013 of Ukraine. No data until 2000. Number of actual observations by date: 3.
Source name:
World Development Indicators
Source organization:
World Bank, International Debt Statistics.
Categories, topics:
External Debt
Last updated:
apr 23, 2017
Indicators value changes by year
Minimum:
7.833 mln
jan 1, 2001
Maximum:
39.351 mln
jan 1, 2013
At the date of observation
Value
Absolute change
Change from the previous value
jan 1, 2001
7.833 mln
+7.833 mln
0.0%
jan 1, 2002
25.068 mln
+17.235 mln
220.03%
jan 1, 2013
39.351 mln
+14.283 mln
56.98%
Ranking of countries by current statistics by years