33
/
AIzaSyB4mHJ5NPEv-XzF7P6NDYXjlkCWaeKw5bc
November 30, 2025
27717
East Asia & Pacific
EAS
false
2
1
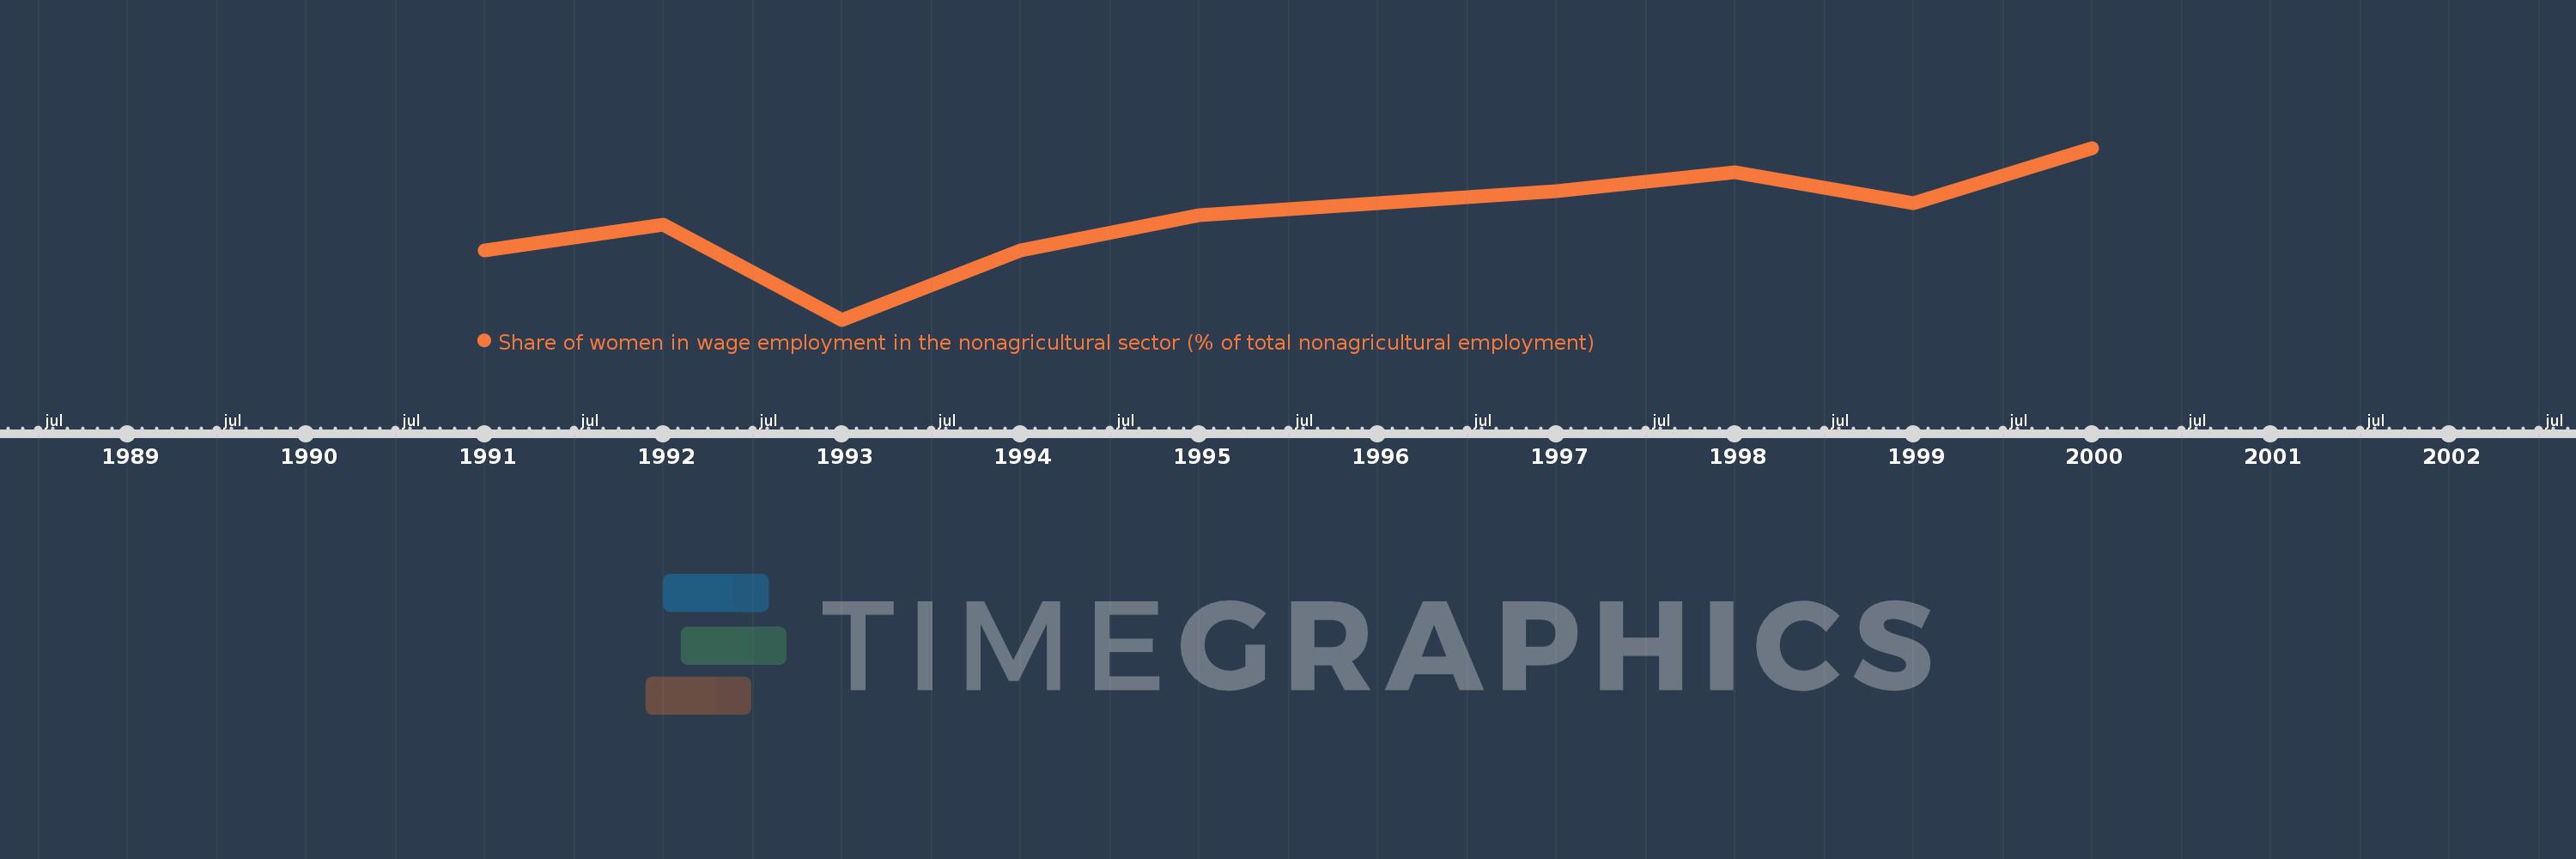
Share of women in wage employment in the nonagricultural sector (% of total nonagricultural employment)
2000,1999,1998,1997,1996,1995,1994,1993,1992,1991