33
/
AIzaSyB4mHJ5NPEv-XzF7P6NDYXjlkCWaeKw5bc
November 30, 2025
138768
Georgia
GEO
true
2
1
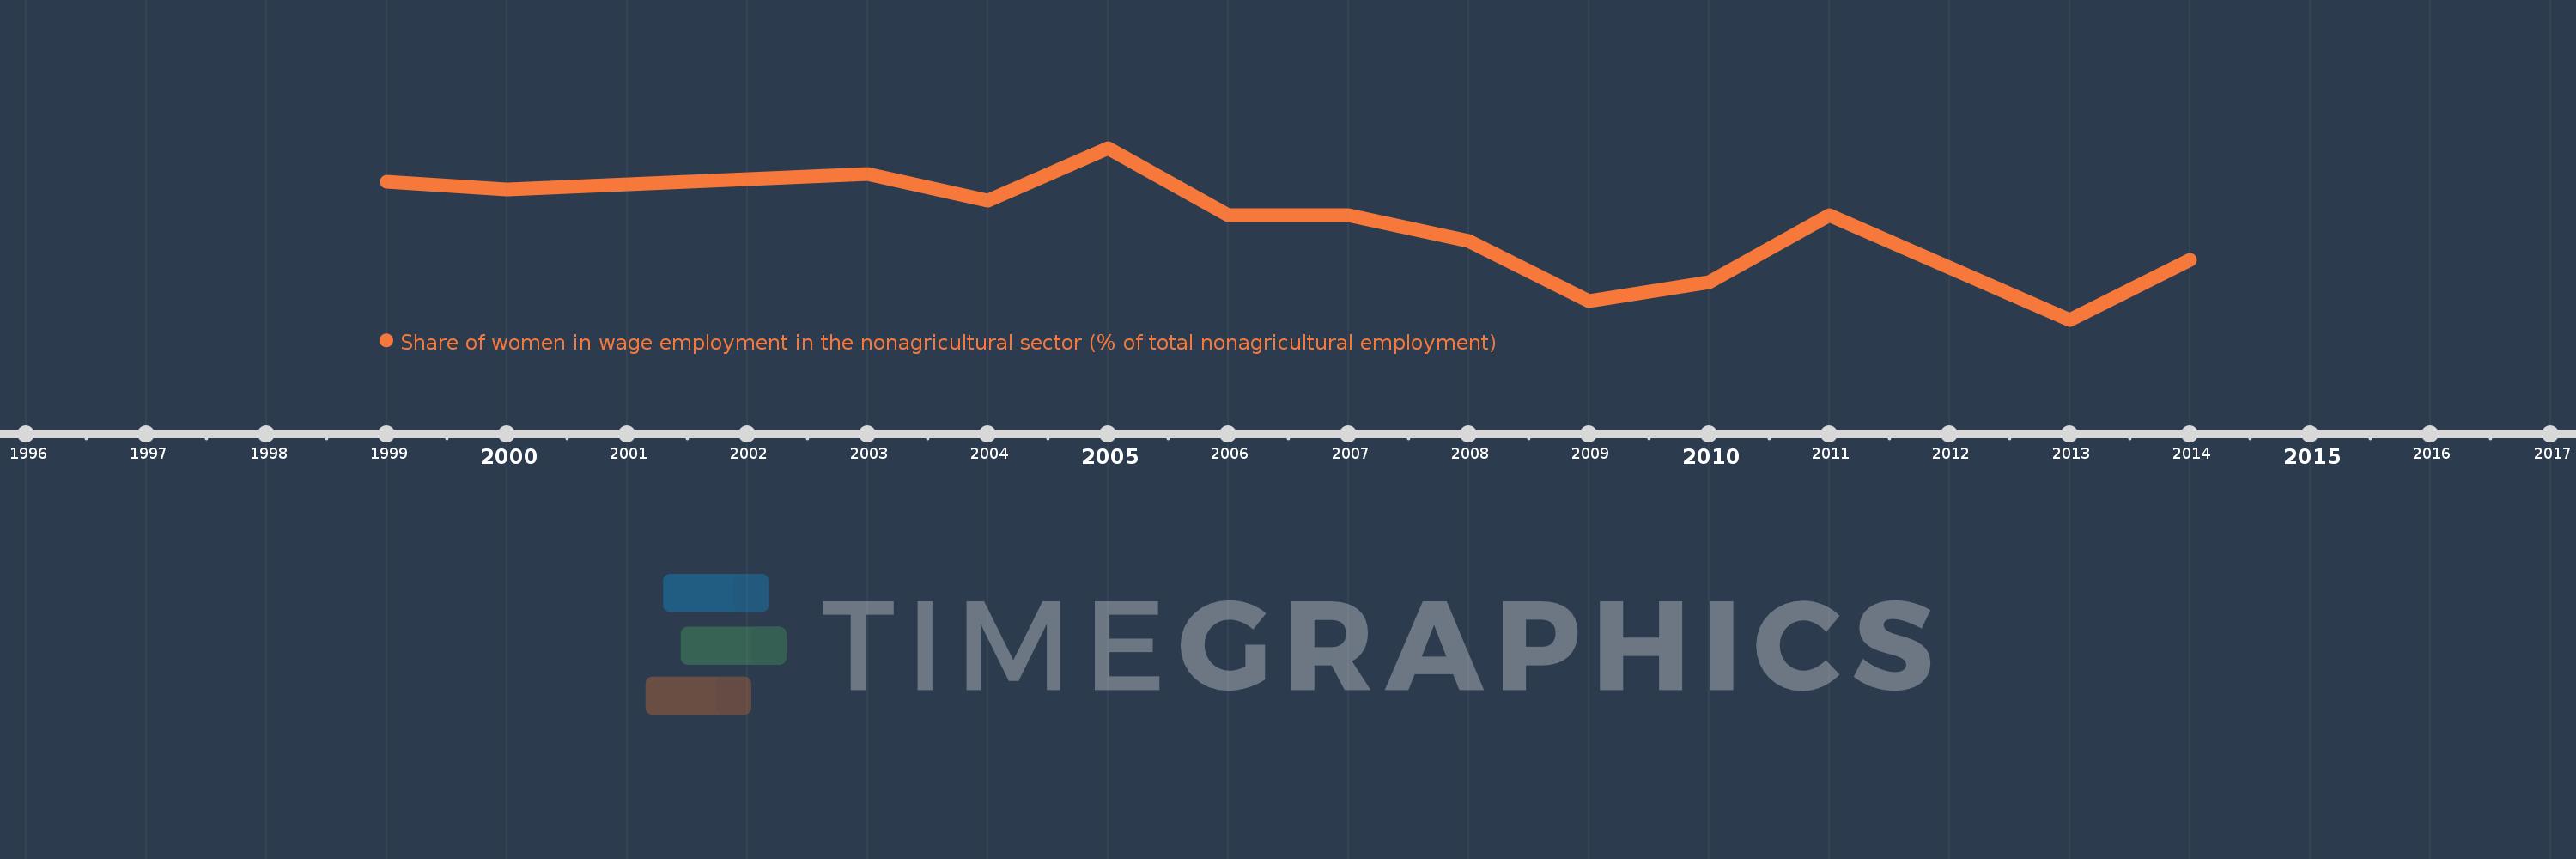
Share of women in wage employment in the nonagricultural sector (% of total nonagricultural employment)
2014,2013,2012,2011,2010,2009,2008,2007,2006,2005,2004,2003,2000,1999