33
/
AIzaSyB4mHJ5NPEv-XzF7P6NDYXjlkCWaeKw5bc
November 30, 2025
201024
Montenegro
MNE
true
2
1
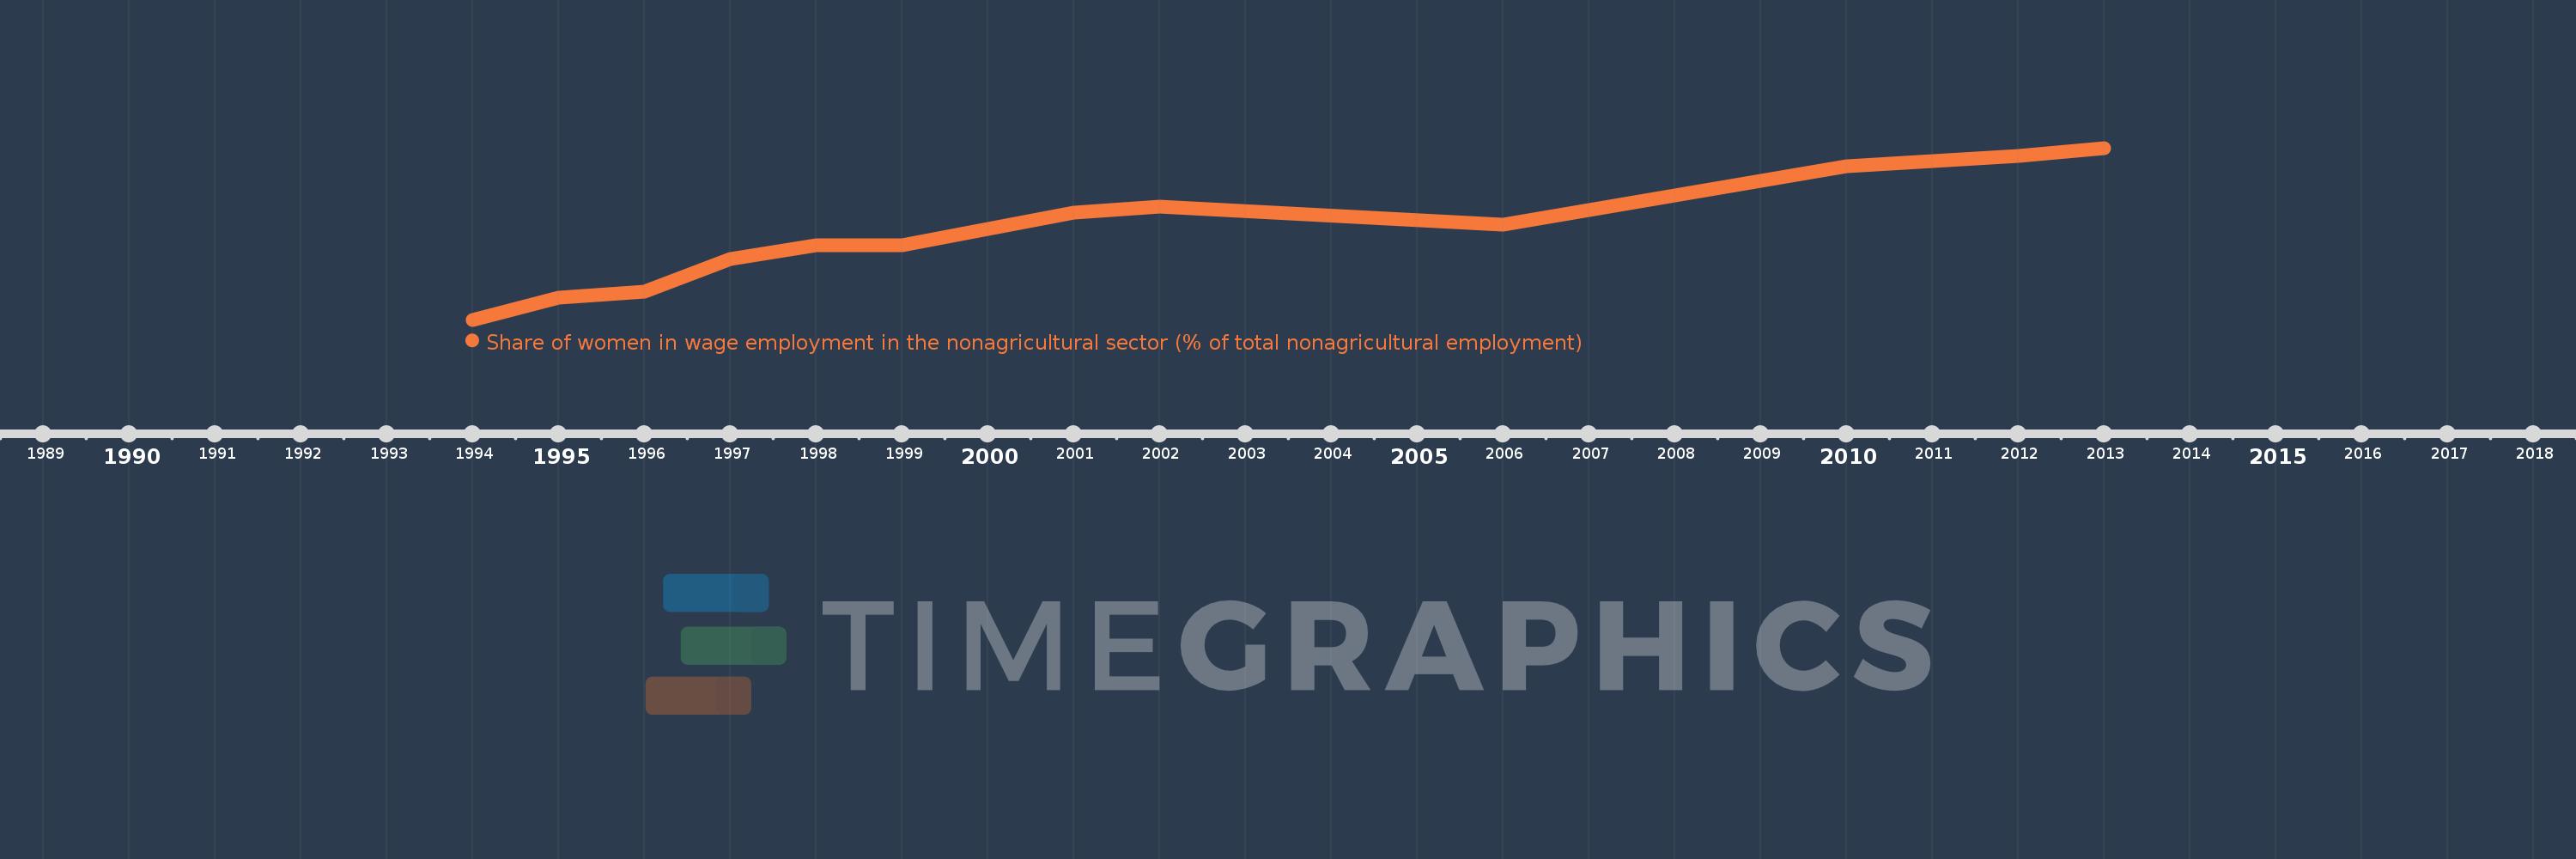
Share of women in wage employment in the nonagricultural sector (% of total nonagricultural employment)
2013,2012,2010,2006,2002,2001,2000,1999,1998,1997,1996,1995,1994