33
/
AIzaSyB4mHJ5NPEv-XzF7P6NDYXjlkCWaeKw5bc
November 30, 2025
274139
Ukraine
UKR
true
2
1
PPG, IBRD (TDS, current US$)
2016,2015,2014,2013,2012,2011,2010,2009,2008,2007,2006,2005,2004,2003,2002,2001,2000,1999,1998,1997,1996,1995
Create a timeline
Public Timelines
For education
For educational institutions
For teachers
For students
Cabinet
For educational institutions
For teachers
For students
Open cabinet
FAQ
Close
Create a timeline
Public timelines
FAQ
About & Feedback
Terms
Privacy
FAQ
Support 24/7
Cabinet
Get premium
Donate
Download
Global statistics library
→
Ukraine
→
PPG, IBRD (TDS, current US$)
This statistics in other country:
Albania
Algeria
Angola
Argentina
Armenia
Azerbaijan
Bangladesh
Belarus
Belize
Bolivia
Bosnia and Herzegovina
Botswana
Brazil
Bulgaria
Burundi
Cabo Verde
Cameroon
Chad
China
Colombia
Congo, Dem. Rep.
Congo, Rep.
Costa Rica
Cote d'Ivoire
Dominica
Dominican Republic
East Asia & Pacific (excluding high income)
Ecuador
Egypt, Arab Rep.
El Salvador
Ethiopia
Europe & Central Asia (excluding high income)
Fiji
Gabon
Georgia
Ghana
Grenada
Guatemala
Guinea
Guyana
Haiti
Honduras
IDA only
India
Indonesia
Iran, Islamic Rep.
Jamaica
Jordan
Kazakhstan
Kenya
Kosovo
Latin America & Caribbean (excluding high income)
Lebanon
Lesotho
Liberia
Low & middle income
Low income
Lower middle income
Macedonia, FYR
Madagascar
Malawi
Malaysia
Mauritania
Mauritius
Mexico
Middle East & North Africa (excluding high income)
Middle income
Moldova
Montenegro
Morocco
Myanmar
Nicaragua
Nigeria
Pakistan
Panama
Papua New Guinea
Paraguay
Peru
Philippines
Romania
Russian Federation
Senegal
Serbia
Sierra Leone
South Africa
South Asia
Sri Lanka
St. Lucia
St. Vincent and the Grenadines
Sub-Saharan Africa (excluding high income)
Sudan
Swaziland
Syrian Arab Republic
Tanzania
Thailand
Togo
Tunisia
Turkey
Turkmenistan
Uganda
Ukraine
Upper middle income
Uzbekistan
Venezuela, RB
Vietnam
Zambia
Zimbabwe
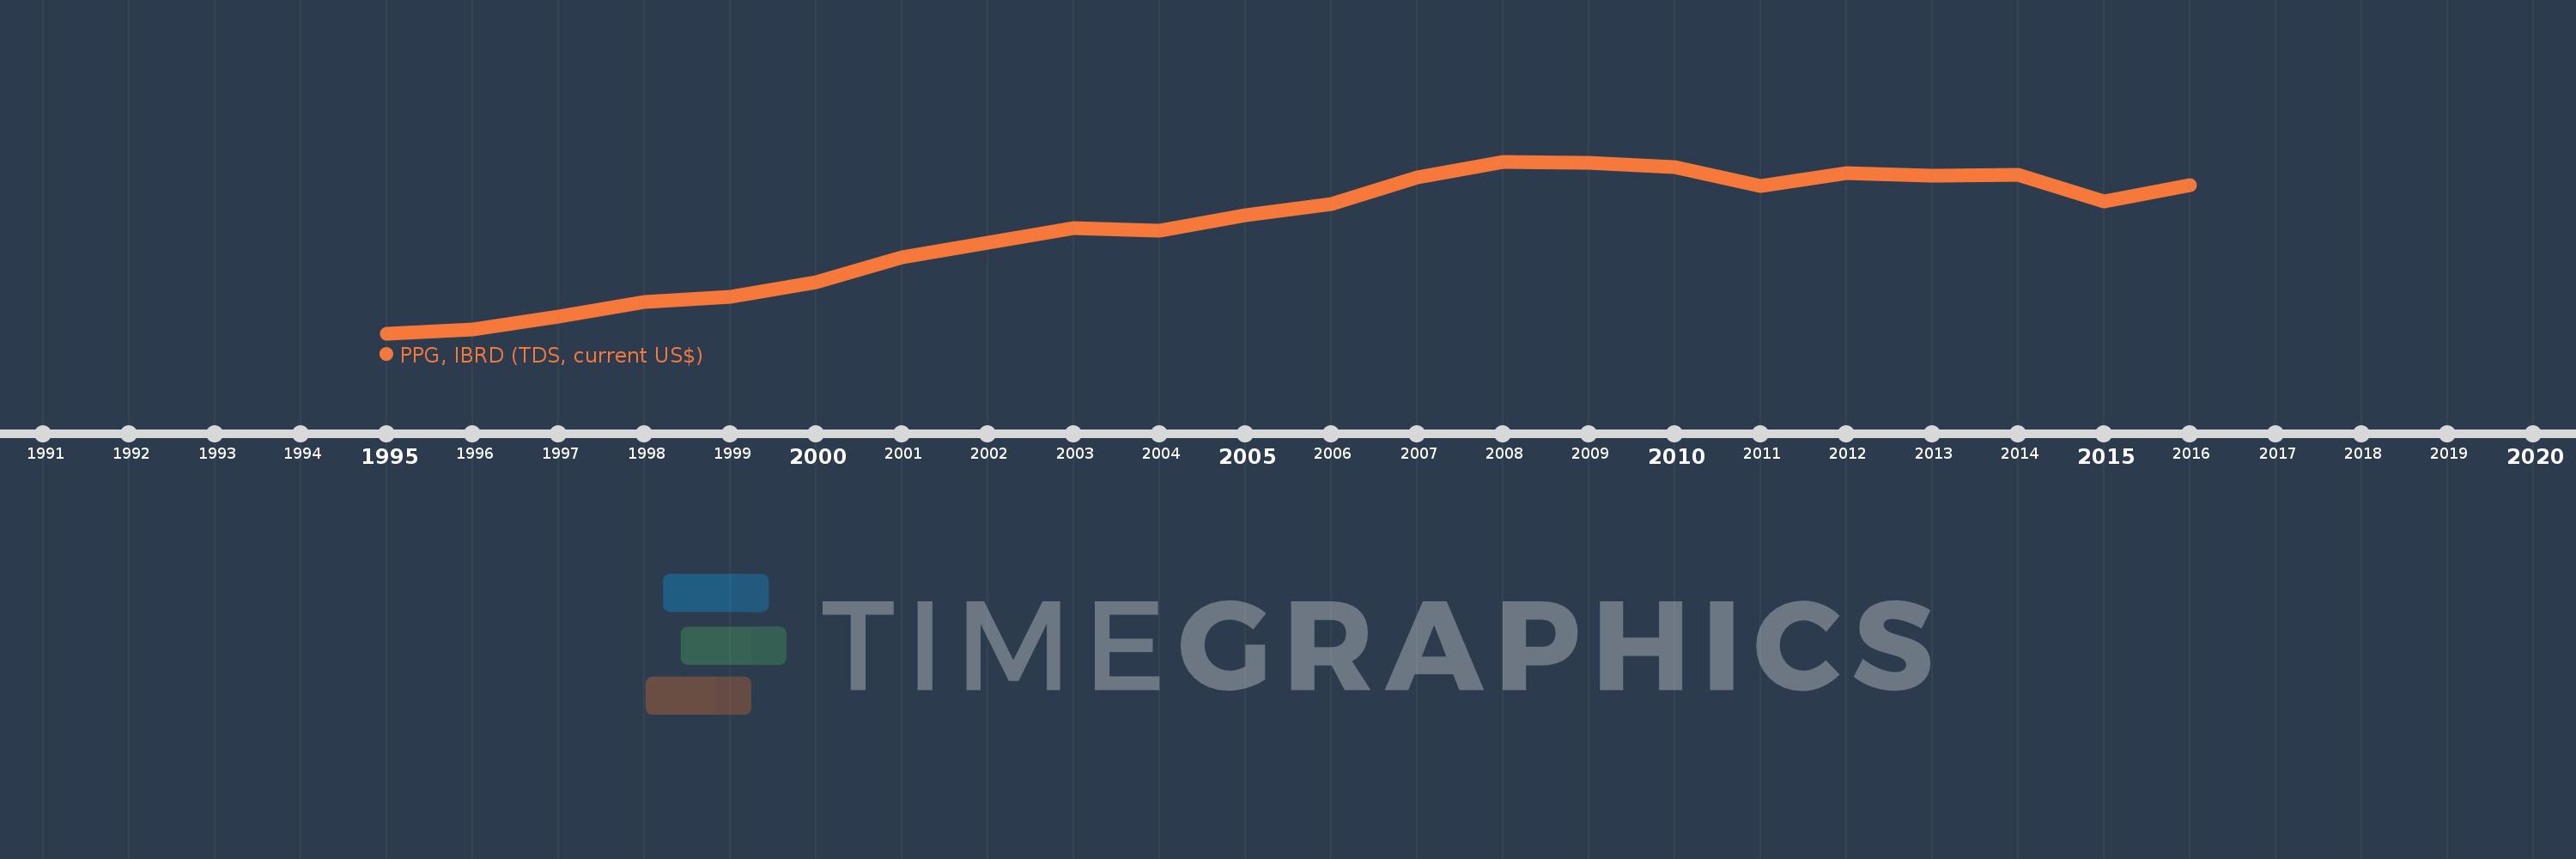
Timeline:
This timeline shows a graph from
1995
to
2016
of Ukraine. No data until
1994
. Number of actual observations by date:
22
.
Source name:
World Development Indicators
Source organization:
World Bank, International Debt Statistics.
Categories, topics:
External Debt
Last updated:
apr 23, 2017
Indicators value changes by year
Meaning:
198.939 mln
Minimum:
74.0K
jan 1, 1995
Maximum:
322.608 mln
jan 1, 2008
At the date of observation
Value
Absolute change
Change from the previous value
jan 1, 1995
74.0K
+74.0K
0.0%
jan 1, 1996
7.895 mln
+7.821 mln
10.57K%
jan 1, 1997
32.138 mln
+24.243 mln
307.07%
jan 1, 1998
58.547 mln
+26.409 mln
82.17%
jan 1, 1999
67.93 mln
+9.383 mln
16.03%
jan 1, 2000
96.304 mln
+28.374 mln
41.77%
jan 1, 2001
142.118 mln
+45.814 mln
47.57%
jan 1, 2002
170.977 mln
+28.859 mln
20.31%
jan 1, 2003
197.95 mln
+26.973 mln
15.78%
jan 1, 2004
192.751 mln
-5.199 mln
-2.63%
jan 1, 2005
221.856 mln
+29.105 mln
15.1%
jan 1, 2006
243.539 mln
+21.683 mln
9.77%
jan 1, 2007
292.295 mln
+48.756 mln
20.02%
jan 1, 2008
322.608 mln
+30.313 mln
10.37%
jan 1, 2009
320.937 mln
-1.671 mln
-0.52%
jan 1, 2010
312.354 mln
-8.583 mln
-2.67%
jan 1, 2011
277.371 mln
-34.983 mln
-11.2%
jan 1, 2012
301.018 mln
+23.647 mln
8.53%
jan 1, 2013
295.556 mln
-5.462 mln
-1.81%
jan 1, 2014
297.102 mln
+1.546 mln
0.52%
jan 1, 2015
247.792 mln
-49.31 mln
-16.6%
jan 1, 2016
277.552 mln
+29.76 mln
12.01%
Ranking of countries by current statistics by years
About & Feedback
Terms
Privacy
FAQ
Support 24/7
Cabinet
Get premium
Donate
The service accepts bank transfer (ACH, Wire) or cards (Visa, MasterCard, etc). Processed by Stripe.
Secured with SSL