33
/
AIzaSyB4mHJ5NPEv-XzF7P6NDYXjlkCWaeKw5bc
November 30, 2025
230292
Russian Federation
RUS
true
2
1
PPG, IBRD (TDS, current US$)
2016,2015,2014,2013,2012,2011,2010,2009,2008,2007,2006,2005,2004,2003,2002,2001,2000,1999,1998,1997,1996,1995,1994
Create a timeline
Public Timelines
For education
For educational institutions
For teachers
For students
Cabinet
For educational institutions
For teachers
For students
Open cabinet
FAQ
Close
Create a timeline
Public timelines
FAQ
About & Feedback
Terms
Privacy
FAQ
Support 24/7
Cabinet
Get premium
Donate
Download
Global statistics library
→
Russian Federation
→
PPG, IBRD (TDS, current US$)
This statistics in other country:
Albania
Algeria
Angola
Argentina
Armenia
Azerbaijan
Bangladesh
Belarus
Belize
Bolivia
Bosnia and Herzegovina
Botswana
Brazil
Bulgaria
Burundi
Cabo Verde
Cameroon
Chad
China
Colombia
Congo, Dem. Rep.
Congo, Rep.
Costa Rica
Cote d'Ivoire
Dominica
Dominican Republic
East Asia & Pacific (excluding high income)
Ecuador
Egypt, Arab Rep.
El Salvador
Ethiopia
Europe & Central Asia (excluding high income)
Fiji
Gabon
Georgia
Ghana
Grenada
Guatemala
Guinea
Guyana
Haiti
Honduras
IDA only
India
Indonesia
Iran, Islamic Rep.
Jamaica
Jordan
Kazakhstan
Kenya
Kosovo
Latin America & Caribbean (excluding high income)
Lebanon
Lesotho
Liberia
Low & middle income
Low income
Lower middle income
Macedonia, FYR
Madagascar
Malawi
Malaysia
Mauritania
Mauritius
Mexico
Middle East & North Africa (excluding high income)
Middle income
Moldova
Montenegro
Morocco
Myanmar
Nicaragua
Nigeria
Pakistan
Panama
Papua New Guinea
Paraguay
Peru
Philippines
Romania
Russian Federation
Senegal
Serbia
Sierra Leone
South Africa
South Asia
Sri Lanka
St. Lucia
St. Vincent and the Grenadines
Sub-Saharan Africa (excluding high income)
Sudan
Swaziland
Syrian Arab Republic
Tanzania
Thailand
Togo
Tunisia
Turkey
Turkmenistan
Uganda
Ukraine
Upper middle income
Uzbekistan
Venezuela, RB
Vietnam
Zambia
Zimbabwe
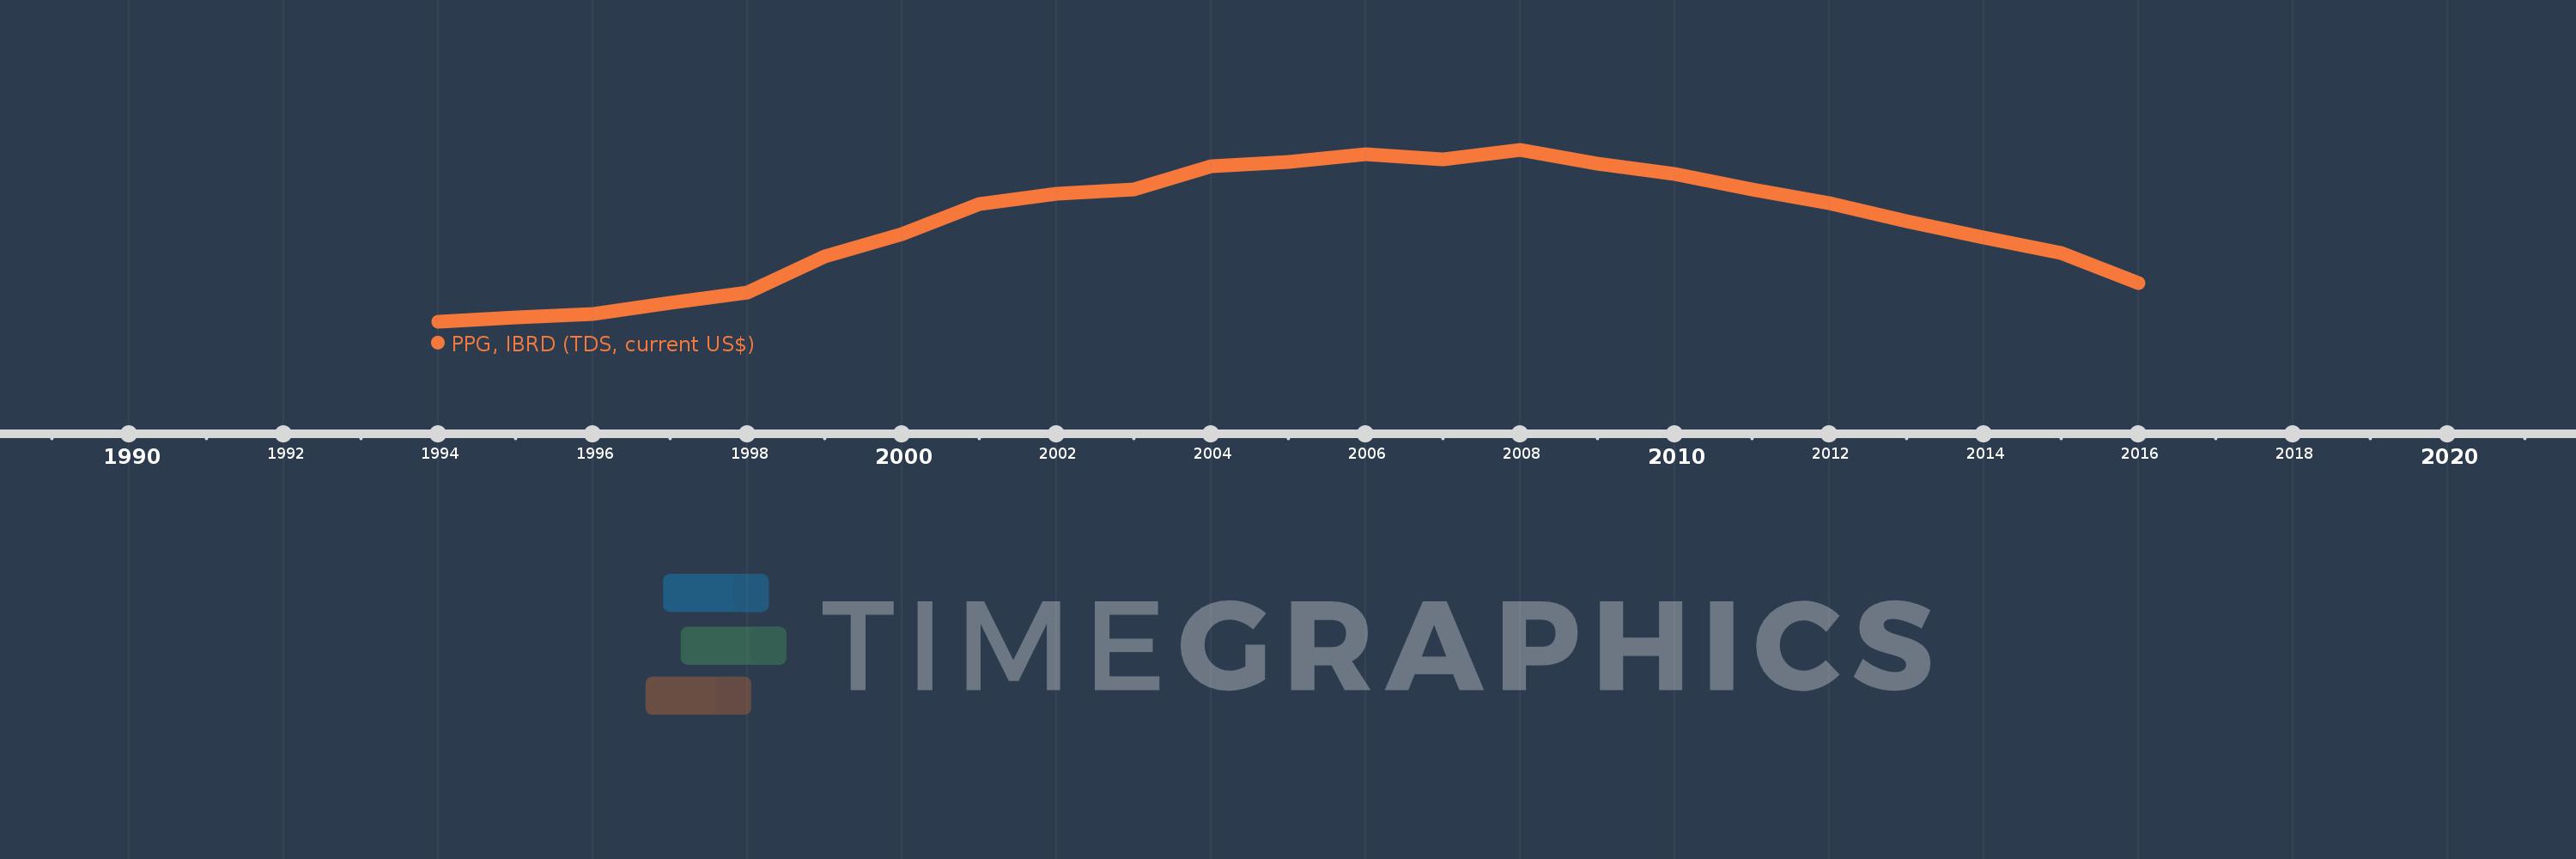
Timeline:
This timeline shows a graph from
1994
to
2016
of Russian Federation. No data until
1993
. Number of actual observations by date:
23
.
Source name:
World Development Indicators
Source organization:
World Bank, International Debt Statistics.
Categories, topics:
External Debt
Last updated:
apr 23, 2017
Indicators value changes by year
Meaning:
568.818 mln
Minimum:
11.622 mln
jan 1, 1994
Maximum:
985.754 mln
jan 1, 2008
At the date of observation
Value
Absolute change
Change from the previous value
jan 1, 1994
11.622 mln
+11.622 mln
0.0%
jan 1, 1995
37.587 mln
+25.965 mln
223.41%
jan 1, 1996
56.841 mln
+19.254 mln
51.23%
jan 1, 1997
120.758 mln
+63.917 mln
112.45%
jan 1, 1998
178.144 mln
+57.386 mln
47.52%
jan 1, 1999
382.321 mln
+204.177 mln
114.61%
jan 1, 2000
509.082 mln
+126.761 mln
33.16%
jan 1, 2001
678.548 mln
+169.466 mln
33.29%
jan 1, 2002
739.044 mln
+60.496 mln
8.92%
jan 1, 2003
763.873 mln
+24.829 mln
3.36%
jan 1, 2004
893.786 mln
+129.913 mln
17.01%
jan 1, 2005
916.929 mln
+23.143 mln
2.59%
jan 1, 2006
963.33 mln
+46.401 mln
5.06%
jan 1, 2007
935.971 mln
-27.359 mln
-2.84%
jan 1, 2008
985.754 mln
+49.783 mln
5.32%
jan 1, 2009
907.298 mln
-78.456 mln
-7.96%
jan 1, 2010
850.972 mln
-56.326 mln
-6.21%
jan 1, 2011
760.929 mln
-90.043 mln
-10.58%
jan 1, 2012
685.853 mln
-75.076 mln
-9.87%
jan 1, 2013
581.039 mln
-104.814 mln
-15.28%
jan 1, 2014
488.994 mln
-92.045 mln
-15.84%
jan 1, 2015
401.773 mln
-87.221 mln
-17.84%
jan 1, 2016
232.375 mln
-169.398 mln
-42.16%
Ranking of countries by current statistics by years
About & Feedback
Terms
Privacy
FAQ
Support 24/7
Cabinet
Get premium
Donate
The service accepts bank transfer (ACH, Wire) or cards (Visa, MasterCard, etc). Processed by Stripe.
Secured with SSL