33
/
AIzaSyB4mHJ5NPEv-XzF7P6NDYXjlkCWaeKw5bc
November 1, 2025
184413
Macedonia, FYR
MKD
true
2
1
PPG, IBRD (TDS, current US$)
2016,2015,2014,2013,2012,2011,2010,2009,2008,2007,2006,2005,2004,2003,2002,2001,2000,1999,1998,1997,1996,1995,1994
Create a timeline
Public Timelines
For education
For educational institutions
For teachers
For students
Cabinet
For educational institutions
For teachers
For students
Open cabinet
FAQ
Get premium
Close
Create a timeline
Public timelines
FAQ
About & Feedback
Terms
Privacy
FAQ
Support 24/7
Cabinet
Get premium
Donate
Download
Global statistics library
→
Macedonia, FYR
→
PPG, IBRD (TDS, current US$)
This statistics in other country:
Albania
Algeria
Angola
Argentina
Armenia
Azerbaijan
Bangladesh
Belarus
Belize
Bolivia
Bosnia and Herzegovina
Botswana
Brazil
Bulgaria
Burundi
Cabo Verde
Cameroon
Chad
China
Colombia
Congo, Dem. Rep.
Congo, Rep.
Costa Rica
Cote d'Ivoire
Dominica
Dominican Republic
East Asia & Pacific (excluding high income)
Ecuador
Egypt, Arab Rep.
El Salvador
Ethiopia
Europe & Central Asia (excluding high income)
Fiji
Gabon
Georgia
Ghana
Grenada
Guatemala
Guinea
Guyana
Haiti
Honduras
IDA only
India
Indonesia
Iran, Islamic Rep.
Jamaica
Jordan
Kazakhstan
Kenya
Kosovo
Latin America & Caribbean (excluding high income)
Lebanon
Lesotho
Liberia
Low & middle income
Low income
Lower middle income
Macedonia, FYR
Madagascar
Malawi
Malaysia
Mauritania
Mauritius
Mexico
Middle East & North Africa (excluding high income)
Middle income
Moldova
Montenegro
Morocco
Myanmar
Nicaragua
Nigeria
Pakistan
Panama
Papua New Guinea
Paraguay
Peru
Philippines
Romania
Russian Federation
Senegal
Serbia
Sierra Leone
South Africa
South Asia
Sri Lanka
St. Lucia
St. Vincent and the Grenadines
Sub-Saharan Africa (excluding high income)
Sudan
Swaziland
Syrian Arab Republic
Tanzania
Thailand
Togo
Tunisia
Turkey
Turkmenistan
Uganda
Ukraine
Upper middle income
Uzbekistan
Venezuela, RB
Vietnam
Zambia
Zimbabwe
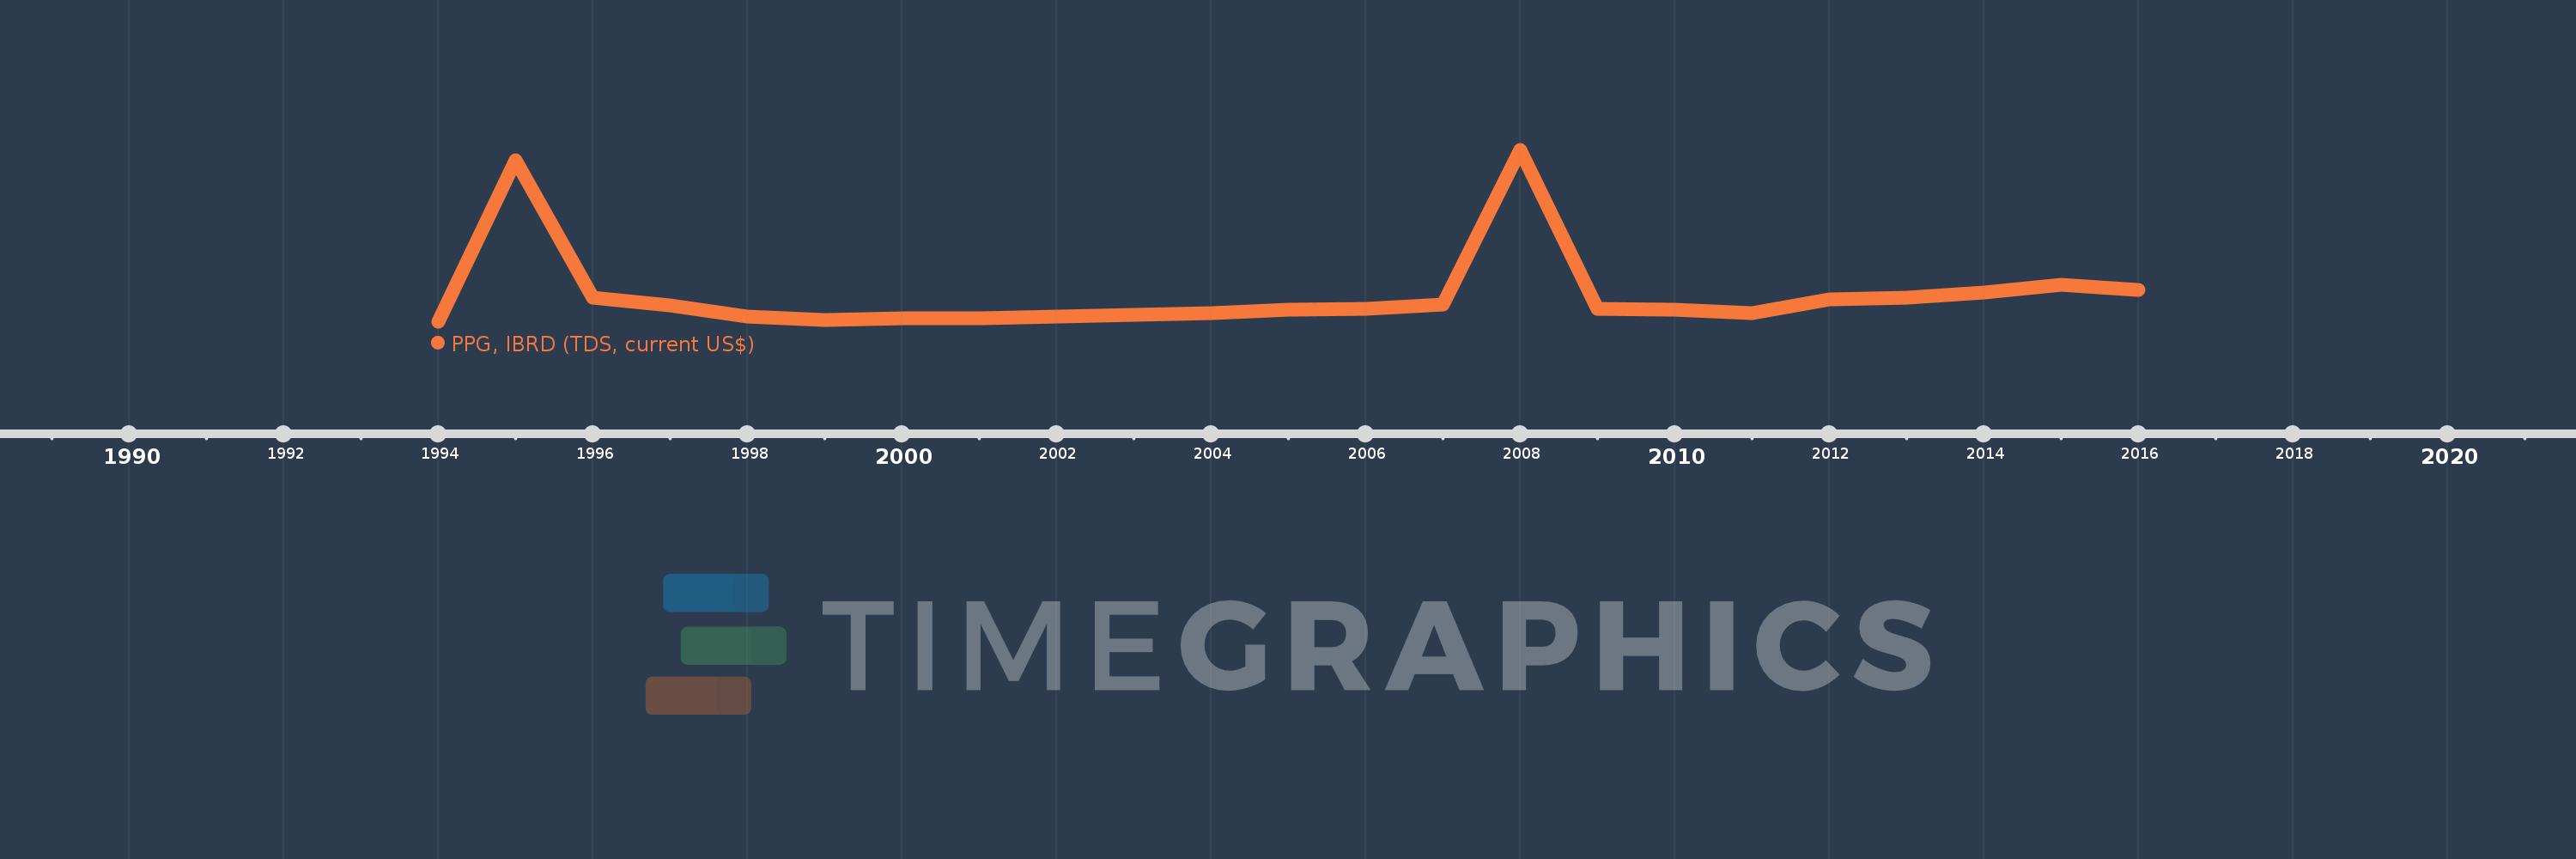
Timeline:
This timeline shows a graph from
1994
to
2016
of Macedonia, FYR. No data until
1993
. Number of actual observations by date:
23
.
Source name:
World Development Indicators
Source organization:
World Bank, International Debt Statistics.
Categories, topics:
External Debt
Last updated:
apr 23, 2017
Indicators value changes by year
Meaning:
29.423 mln
Minimum:
7.485 mln
jan 1, 1994
Maximum:
144.539 mln
jan 1, 2008
At the date of observation
Value
Absolute change
Change from the previous value
jan 1, 1994
7.485 mln
+7.485 mln
0.0%
jan 1, 1995
136.235 mln
+128.75 mln
1.72K%
jan 1, 1996
26.687 mln
-109.548 mln
-80.41%
jan 1, 1997
20.542 mln
-6.145 mln
-23.03%
jan 1, 1998
11.752 mln
-8.79 mln
-42.79%
jan 1, 1999
9.188 mln
-2.564 mln
-21.82%
jan 1, 2000
10.395 mln
+1.207 mln
13.14%
jan 1, 2001
10.747 mln
+352.0K
3.39%
jan 1, 2002
11.782 mln
+1.035 mln
9.63%
jan 1, 2003
13.038 mln
+1.256 mln
10.66%
jan 1, 2004
14.72 mln
+1.682 mln
12.9%
jan 1, 2005
17.03 mln
+2.31 mln
15.69%
jan 1, 2006
18.09 mln
+1.06 mln
6.22%
jan 1, 2007
21.34 mln
+3.25 mln
17.97%
jan 1, 2008
144.539 mln
+123.199 mln
577.31%
jan 1, 2009
17.702 mln
-126.837 mln
-87.75%
jan 1, 2010
17.532 mln
-170.0K
-0.96%
jan 1, 2011
14.299 mln
-3.233 mln
-18.44%
jan 1, 2012
25.528 mln
+11.229 mln
78.53%
jan 1, 2013
27.027 mln
+1.499 mln
5.87%
jan 1, 2014
31.3 mln
+4.273 mln
15.81%
jan 1, 2015
36.879 mln
+5.579 mln
17.82%
jan 1, 2016
32.888 mln
-3.991 mln
-10.82%
Ranking of countries by current statistics by years
About & Feedback
Terms
Privacy
FAQ
Support 24/7
Cabinet
Get premium
Donate
The service accepts bank transfer (ACH, Wire) or cards (Visa, MasterCard, etc). Processed by Stripe.
Secured with SSL