33
/
AIzaSyB4mHJ5NPEv-XzF7P6NDYXjlkCWaeKw5bc
November 30, 2025
265268
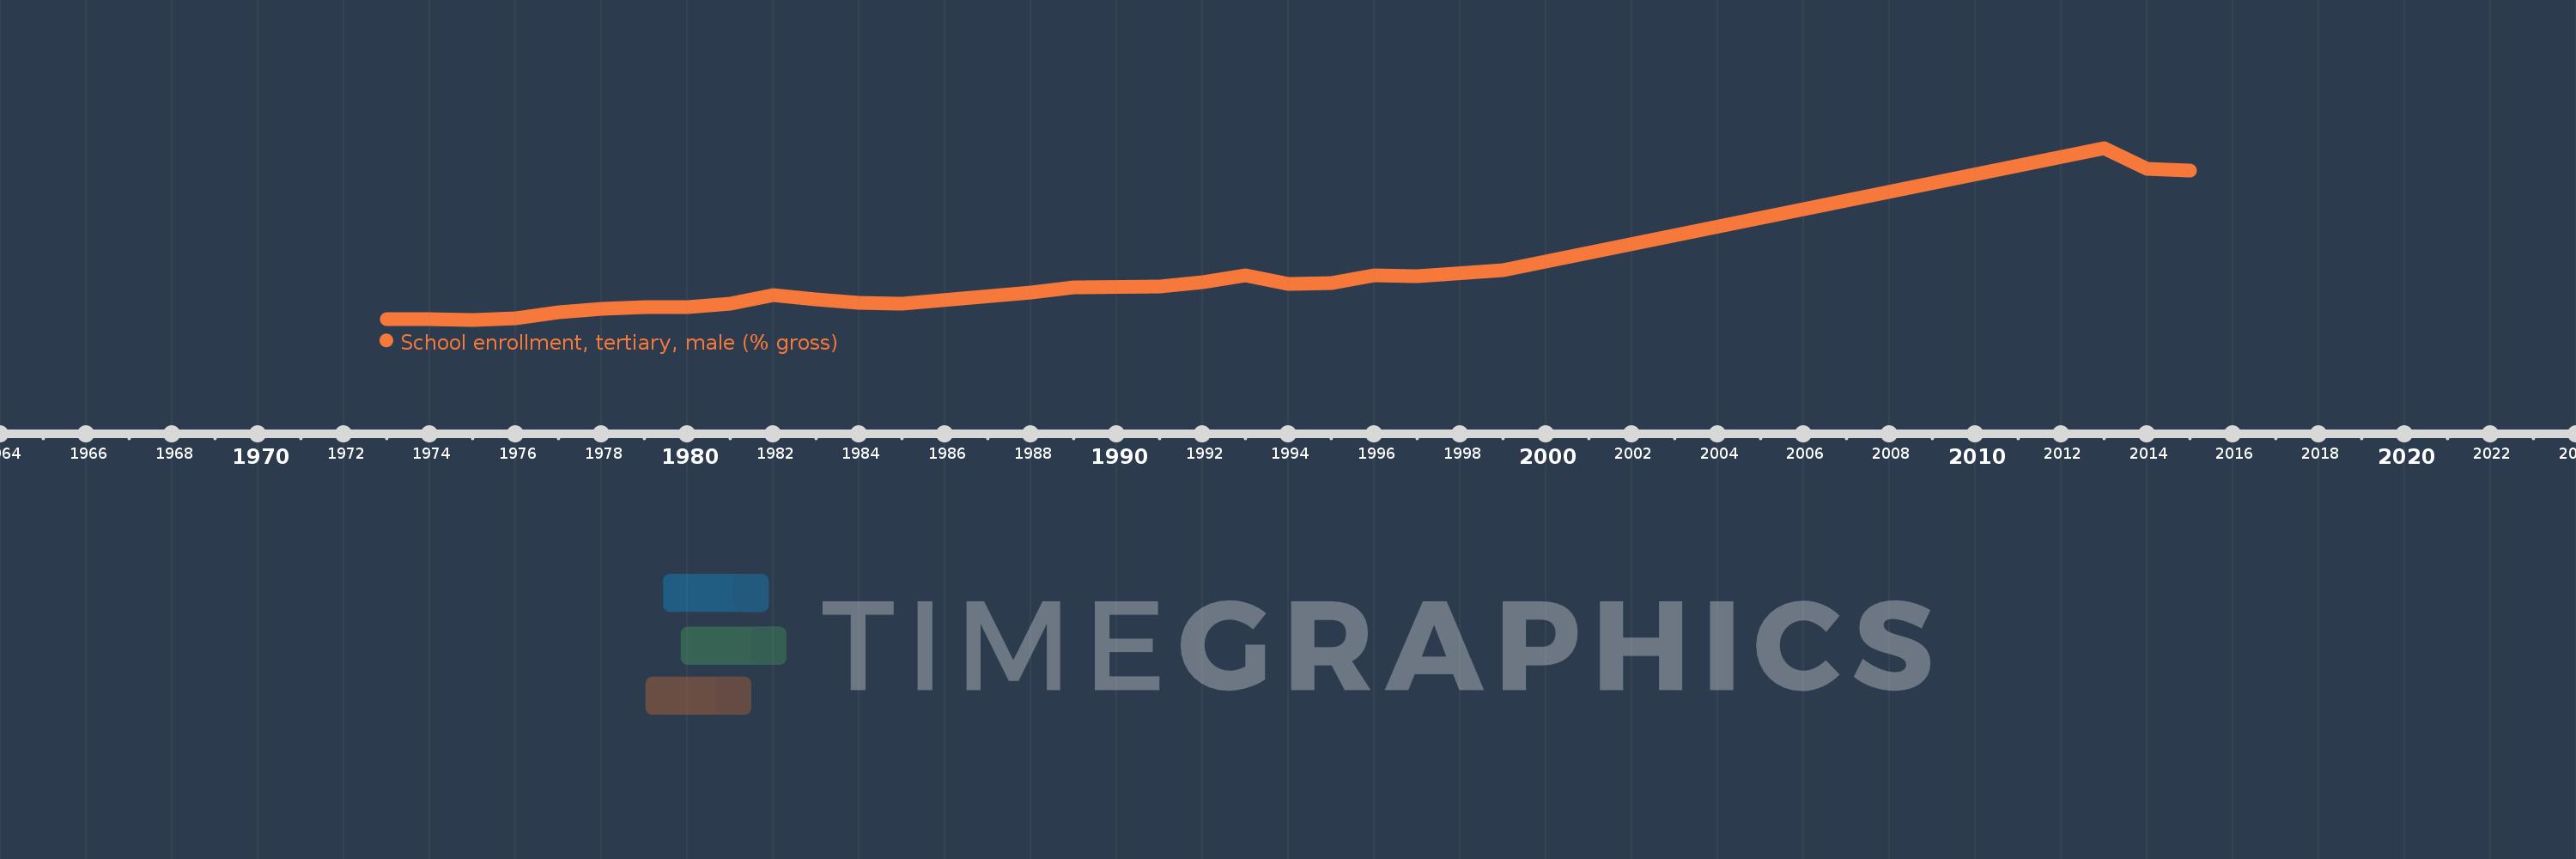
Togo
TGO
true
2
1
School enrollment, tertiary, male (% gross)
2015,2014,2013,1999,1997,1996,1995,1994,1993,1992,1991,1989,1988,1985,1984,1983,1982,1981,1980,1979,1978,1977,1976,1975,1974,1973