33
/
AIzaSyB4mHJ5NPEv-XzF7P6NDYXjlkCWaeKw5bc
November 30, 2025
155316
India
IND
true
2
1
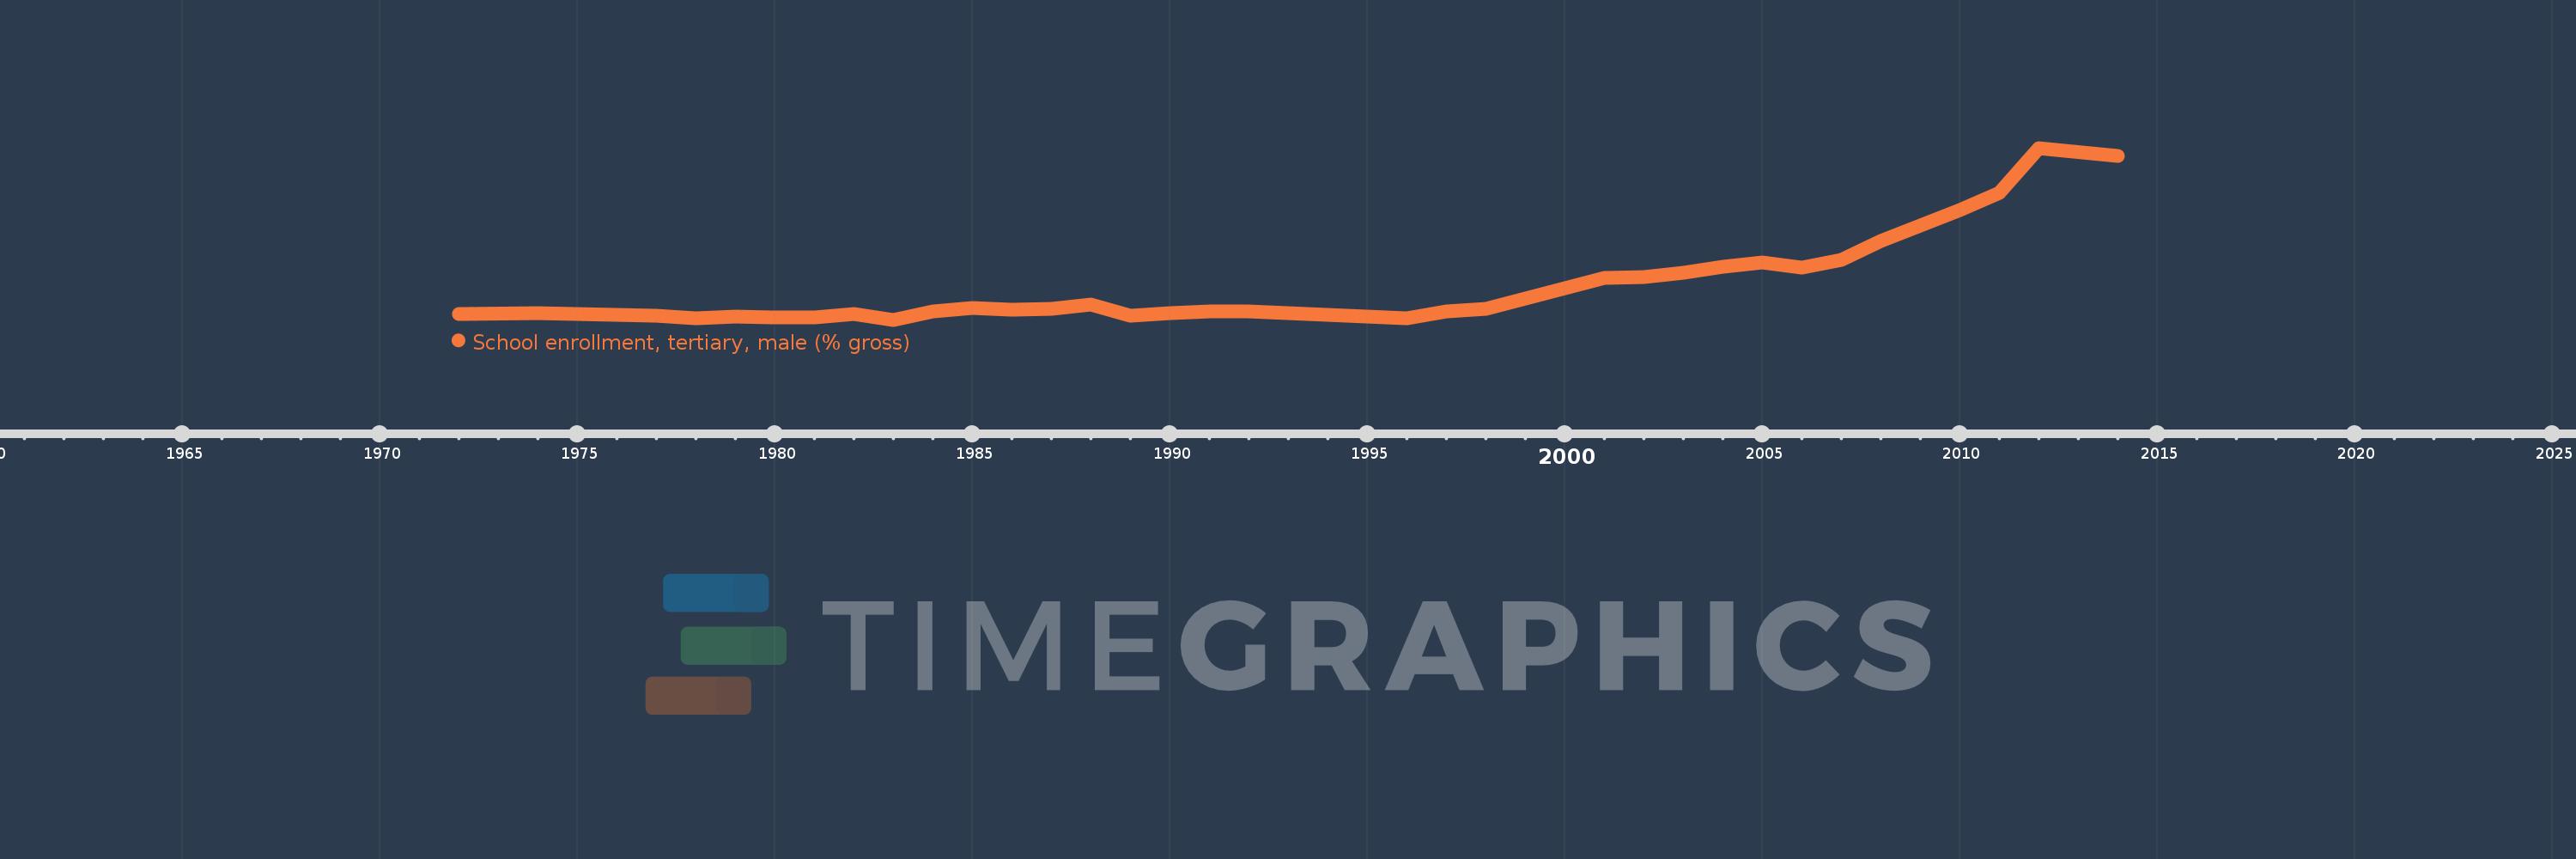
School enrollment, tertiary, male (% gross)
2014,2012,2011,2010,2008,2007,2006,2005,2004,2003,2002,2001,1998,1997,1996,1992,1991,1990,1989,1988,1987,1986,1985,1984,1983,1982,1981,1980,1979,1978,1977,1974,1972