33
/
AIzaSyB4mHJ5NPEv-XzF7P6NDYXjlkCWaeKw5bc
November 30, 2025
111611
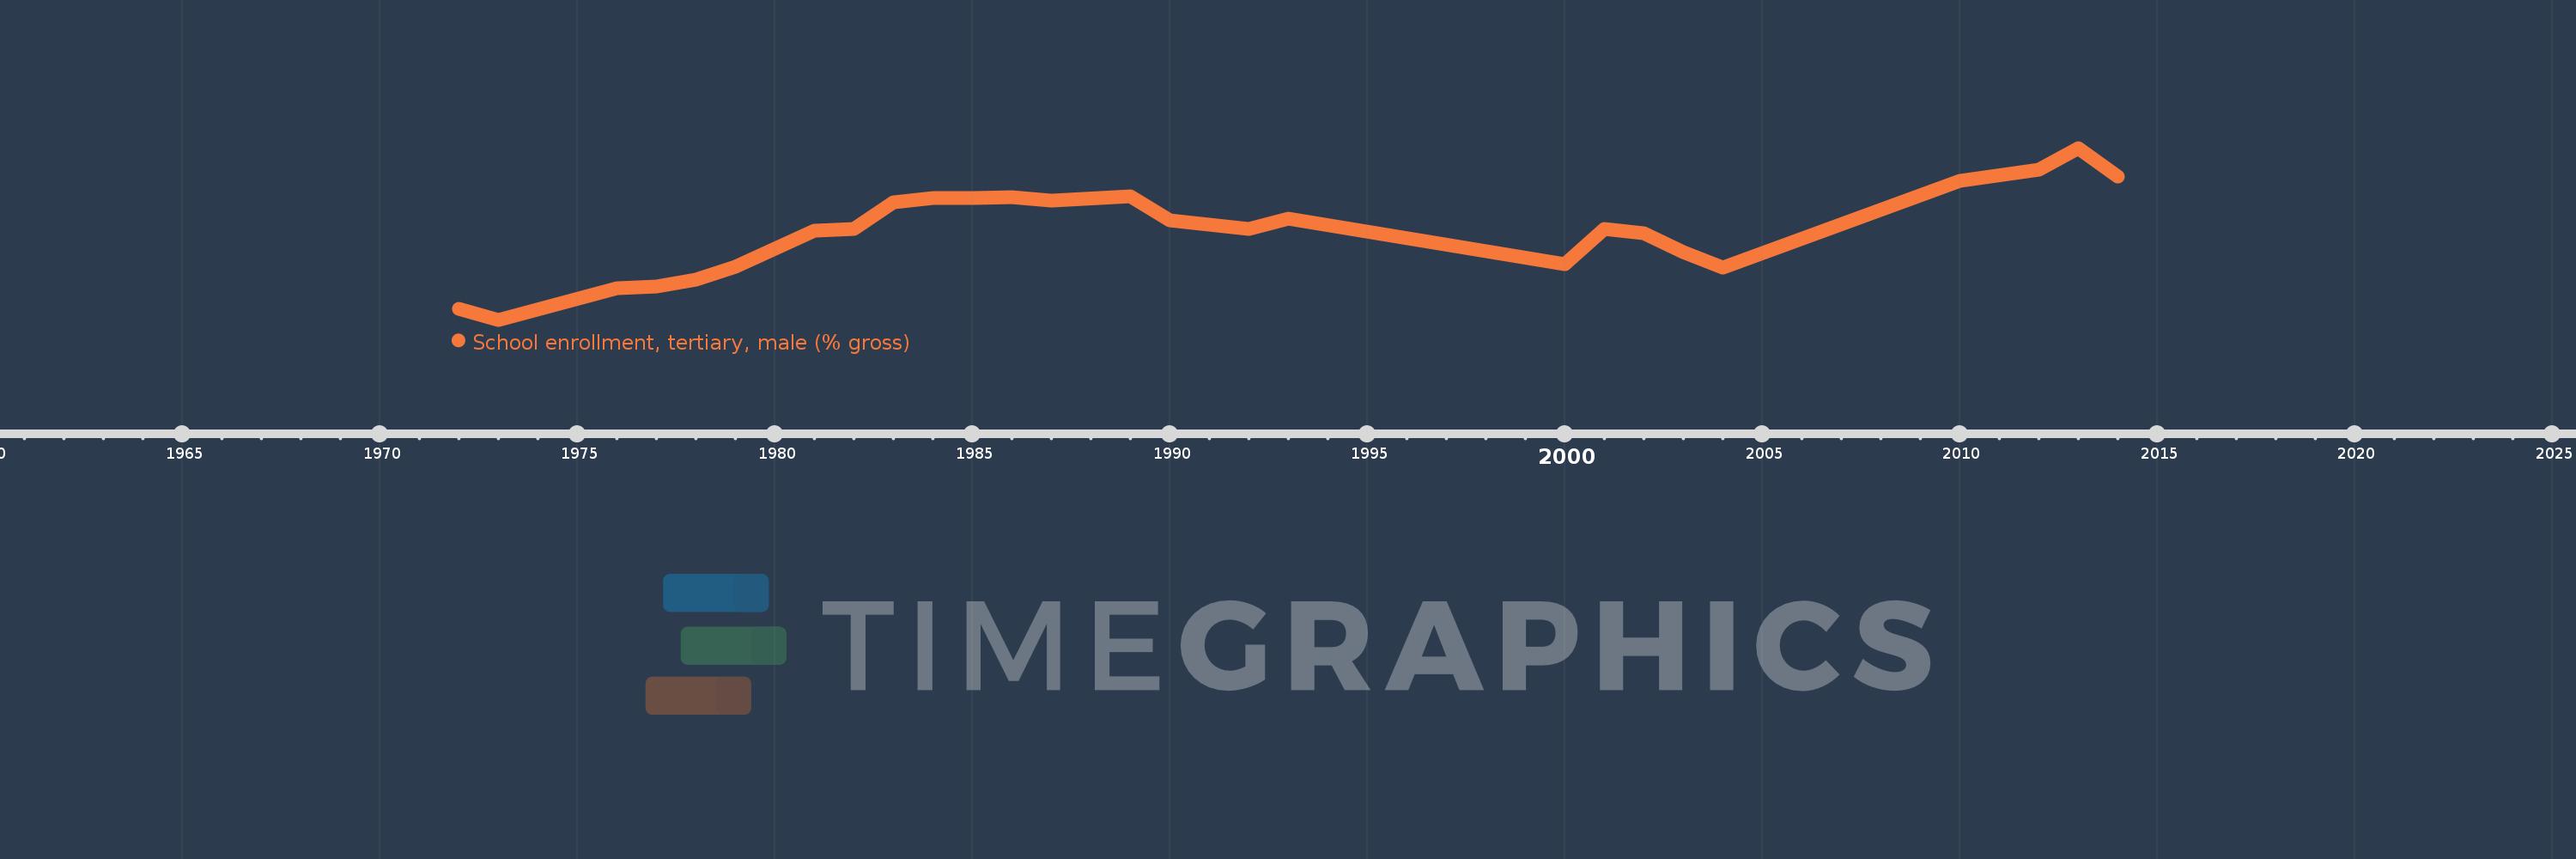
Congo, Rep.
COG
true
2
1
School enrollment, tertiary, male (% gross)
2014,2013,2012,2010,2004,2003,2002,2001,2000,1993,1992,1991,1990,1989,1987,1986,1985,1984,1983,1982,1981,1979,1978,1977,1976,1973,1972