33
/
AIzaSyB4mHJ5NPEv-XzF7P6NDYXjlkCWaeKw5bc
November 30, 2025
262923
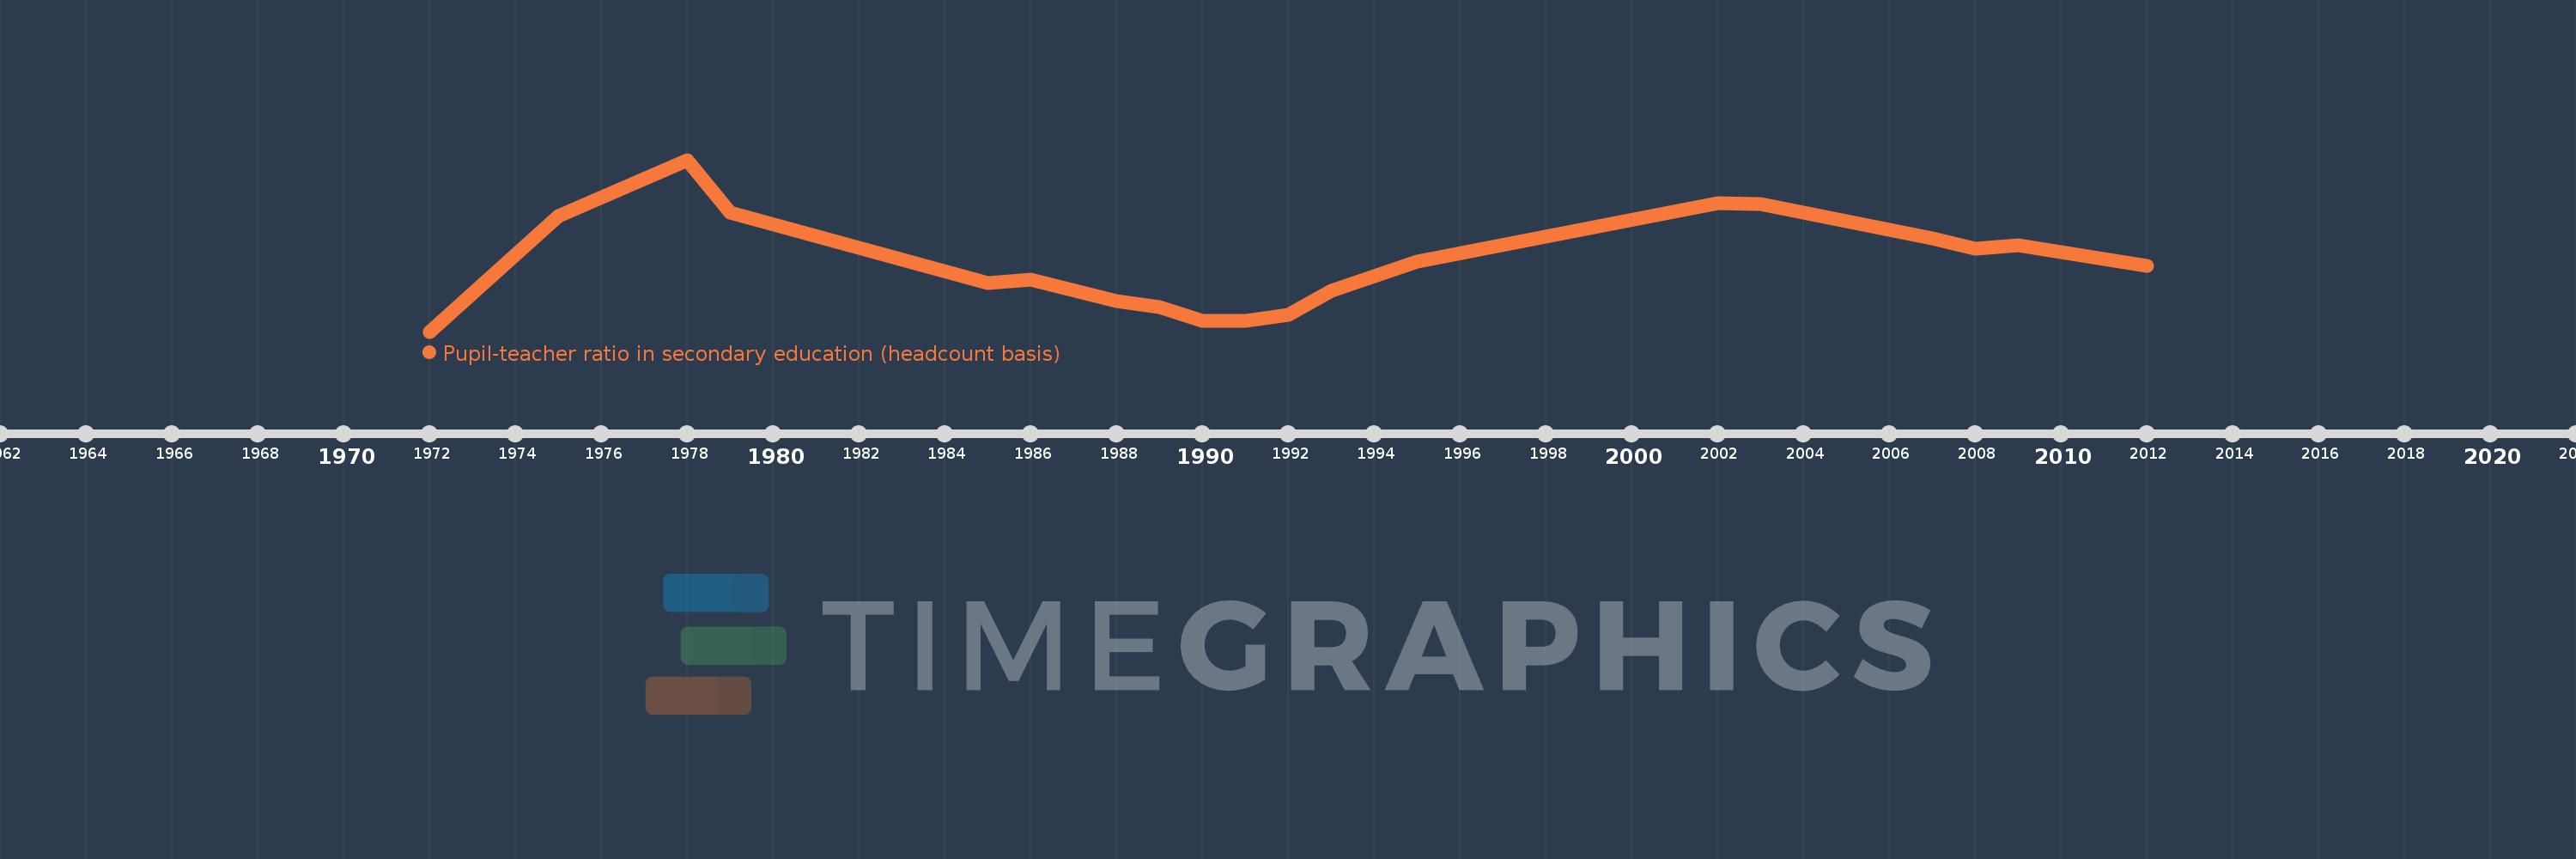
Thailand
THA
true
2
1
Pupil-teacher ratio in secondary education (headcount basis)
2012,2009,2008,2007,2003,2002,1995,1994,1993,1992,1991,1990,1989,1988,1986,1985,1979,1978,1975,1972