33
/
AIzaSyB4mHJ5NPEv-XzF7P6NDYXjlkCWaeKw5bc
November 30, 2025
143514
Grenada
GRD
true
2
1
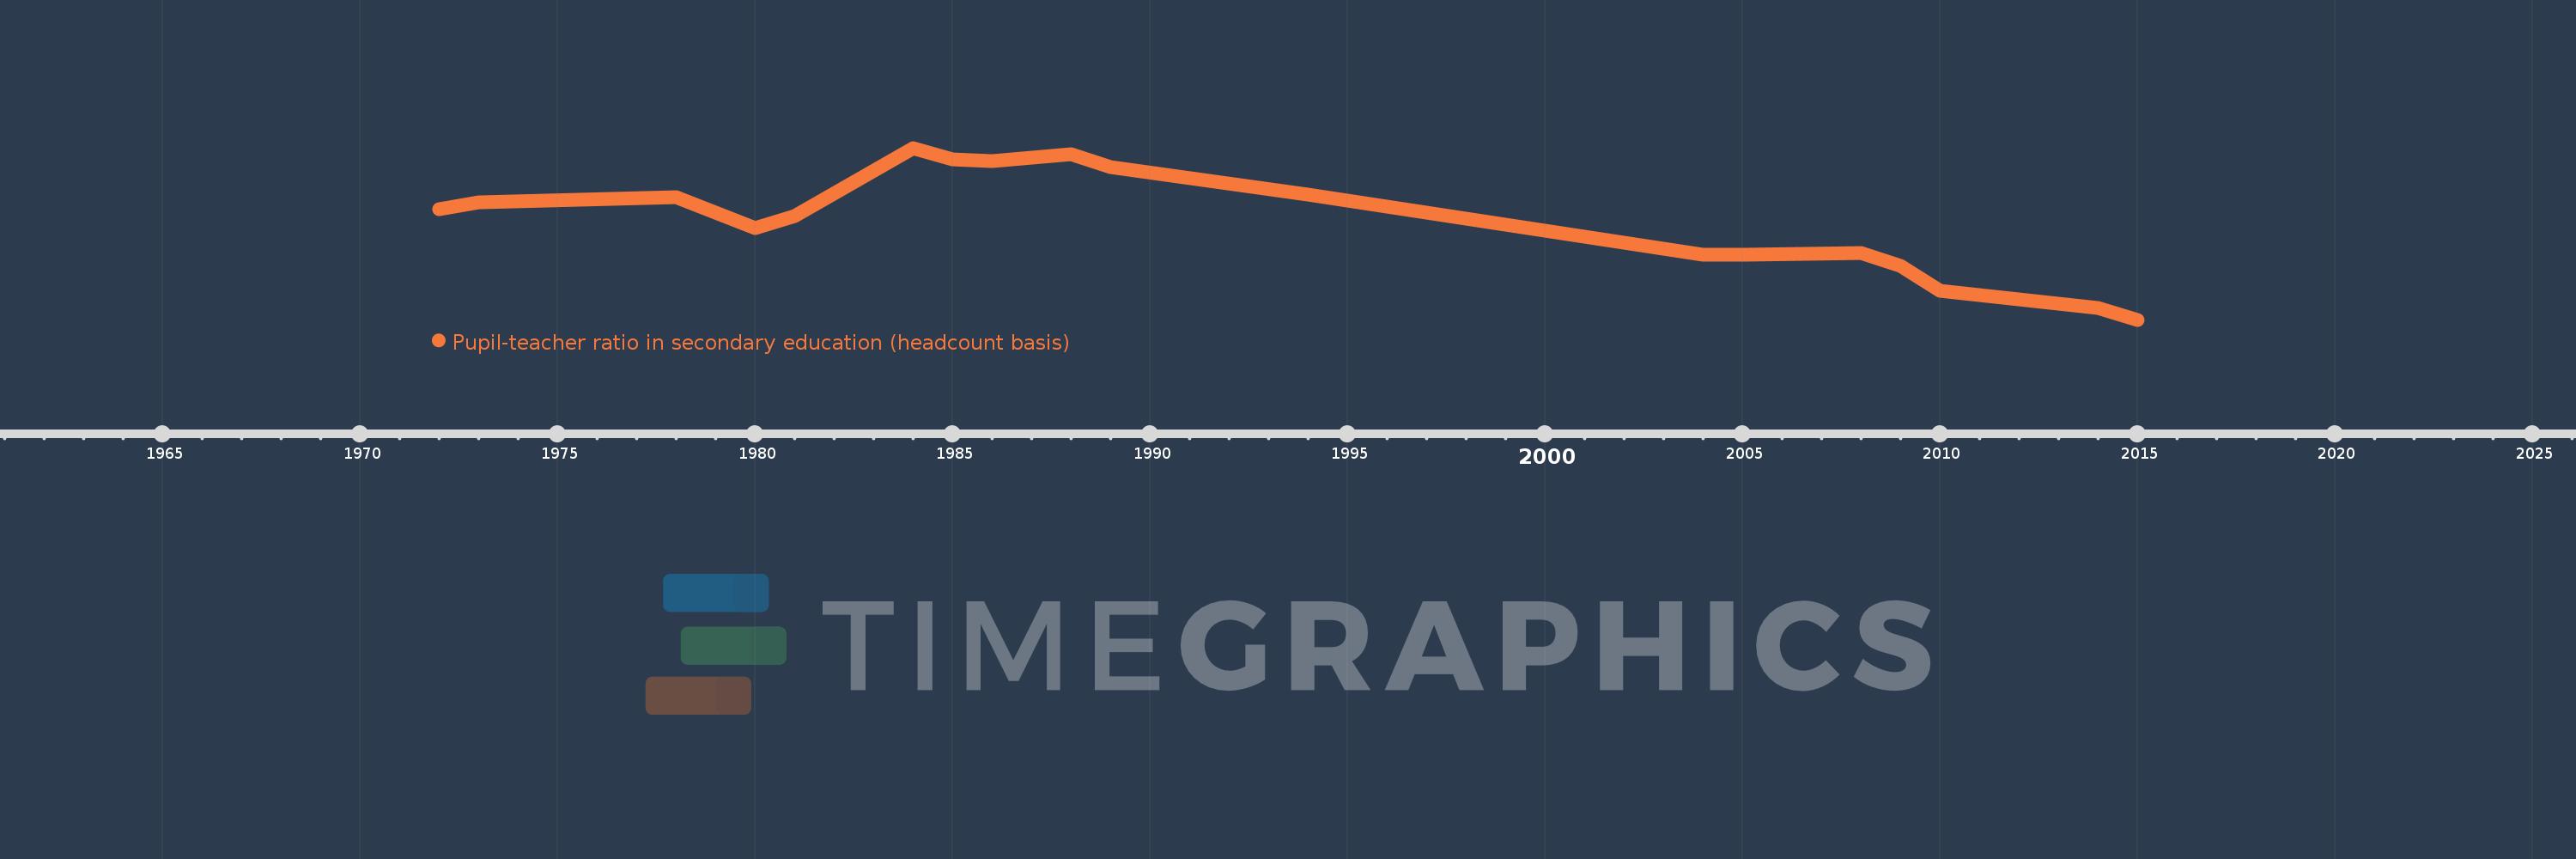
Pupil-teacher ratio in secondary education (headcount basis)
2015,2014,2011,2010,2009,2008,2005,2004,1994,1989,1988,1986,1985,1984,1981,1980,1979,1978,1973,1972