33
/
AIzaSyB4mHJ5NPEv-XzF7P6NDYXjlkCWaeKw5bc
November 30, 2025
217096
Pakistan
PAK
true
2
1
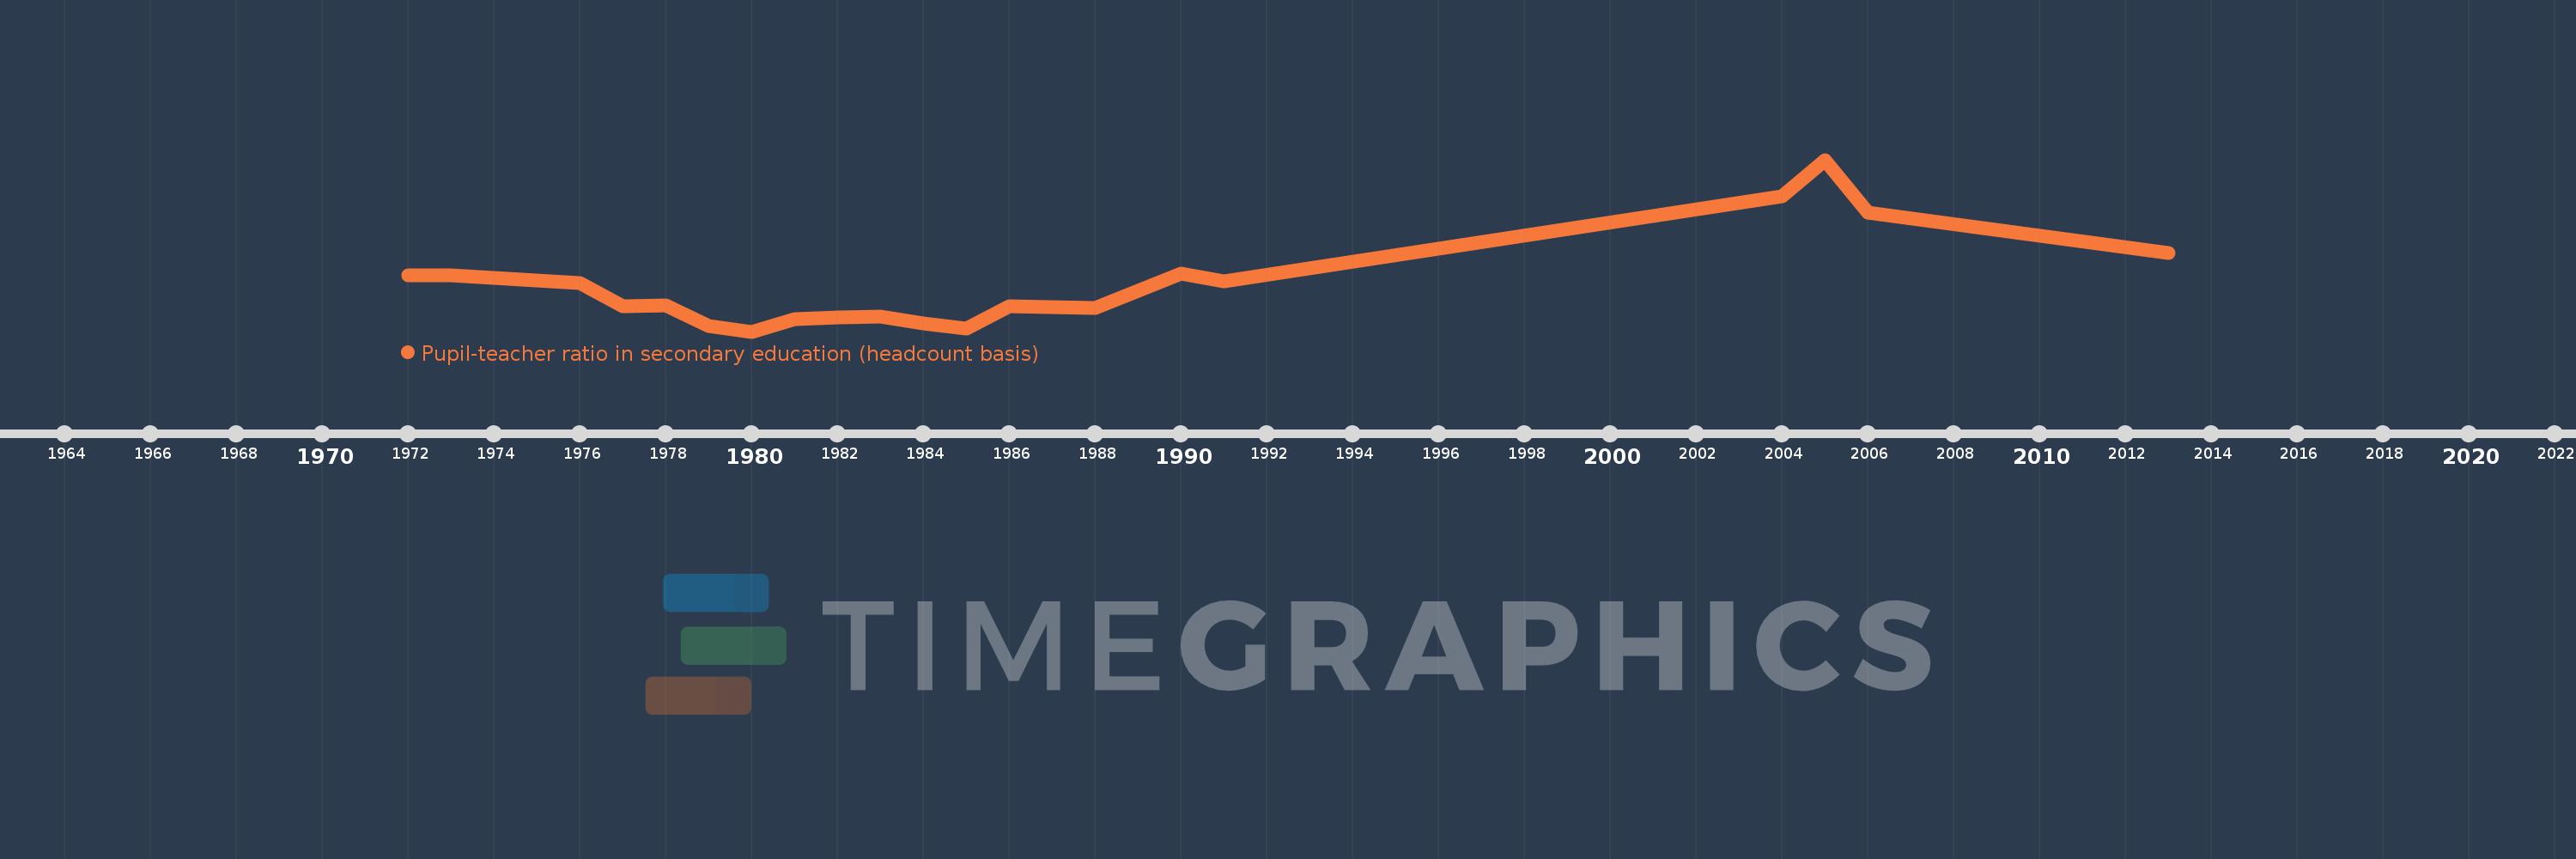
Pupil-teacher ratio in secondary education (headcount basis)
2013,2006,2005,2004,1991,1990,1988,1986,1985,1984,1983,1982,1981,1980,1979,1978,1977,1976,1973,1972