33
/
AIzaSyB4mHJ5NPEv-XzF7P6NDYXjlkCWaeKw5bc
November 30, 2025
249920
St. Kitts and Nevis
KNA
true
2
1
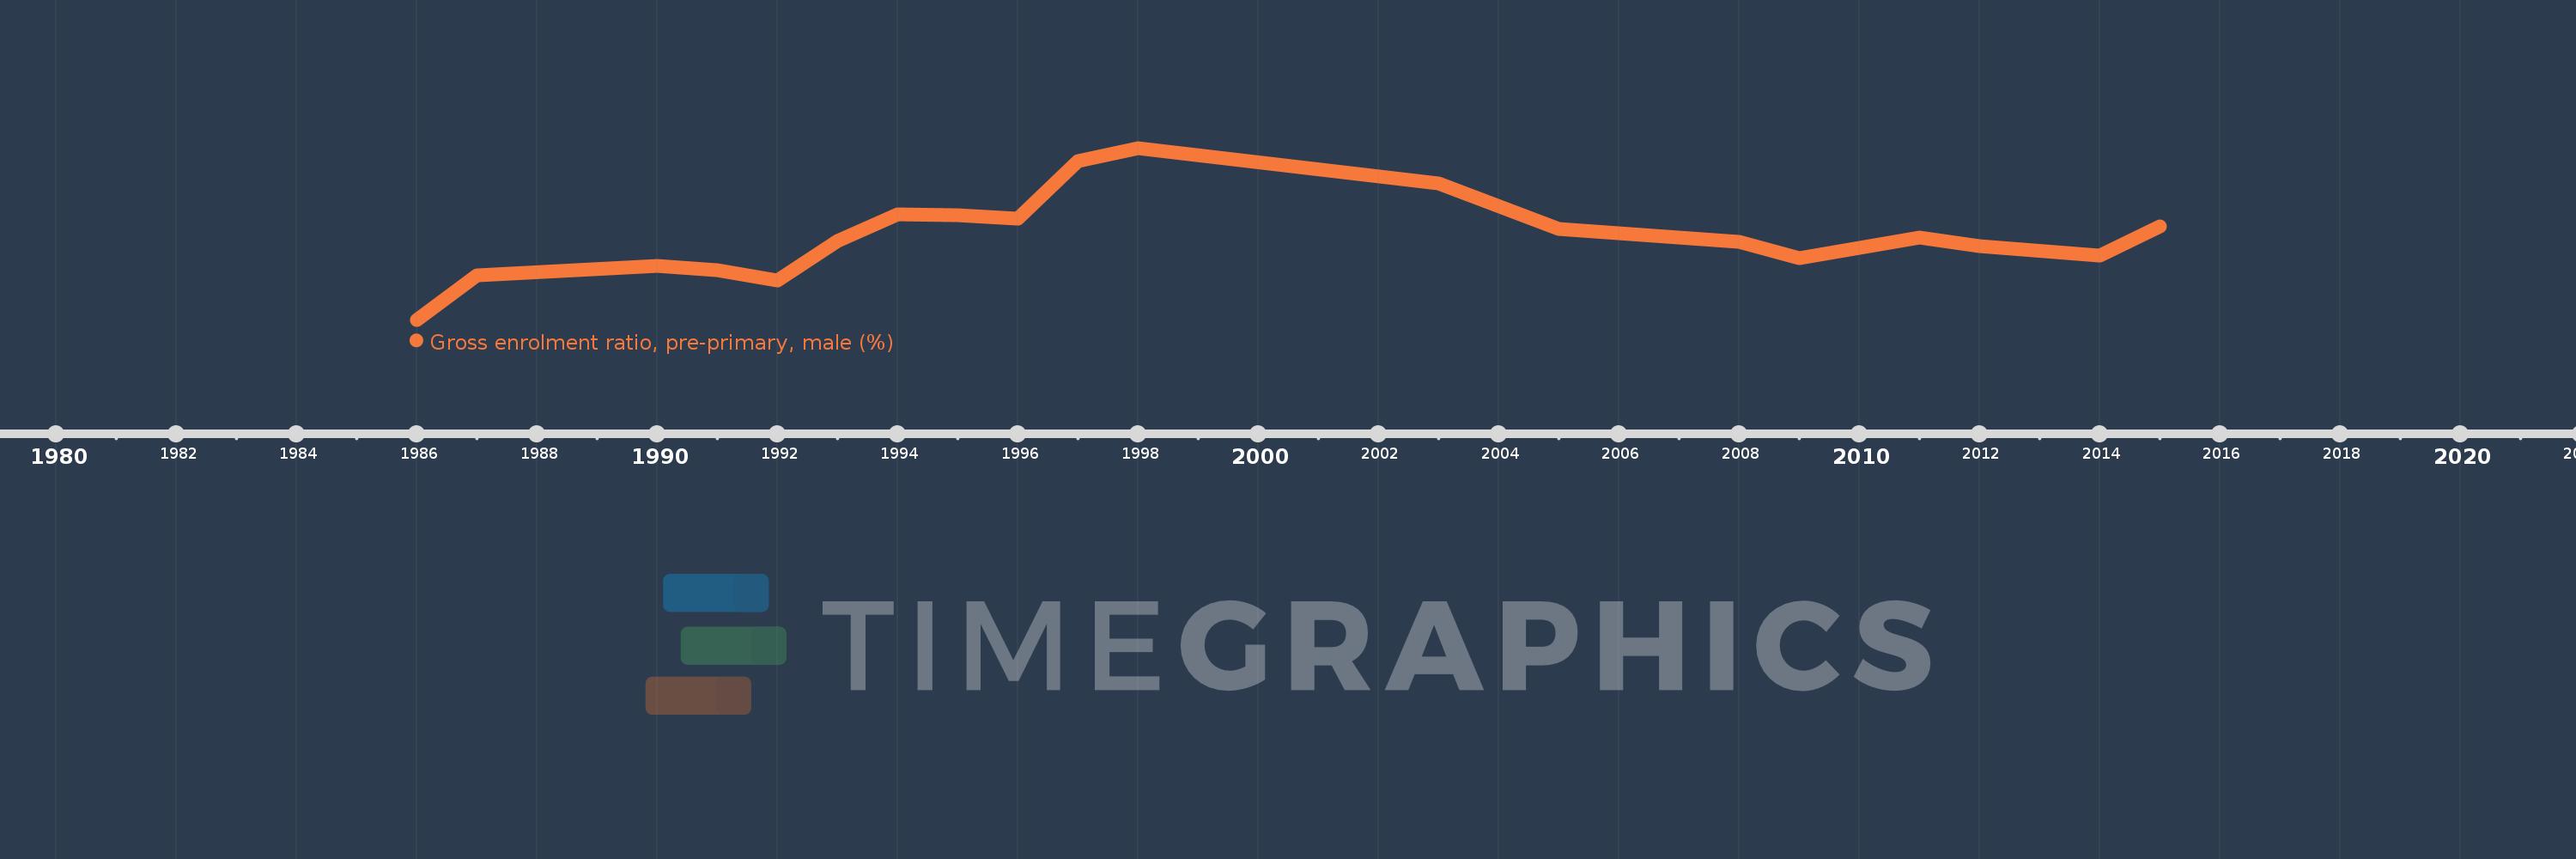
Gross enrolment ratio, pre-primary, male (%)
2015,2014,2012,2011,2010,2009,2008,2006,2005,2003,1998,1997,1996,1995,1994,1993,1992,1991,1990,1987,1986