33
/
AIzaSyB4mHJ5NPEv-XzF7P6NDYXjlkCWaeKw5bc
November 30, 2025
162612
Jamaica
JAM
true
2
1
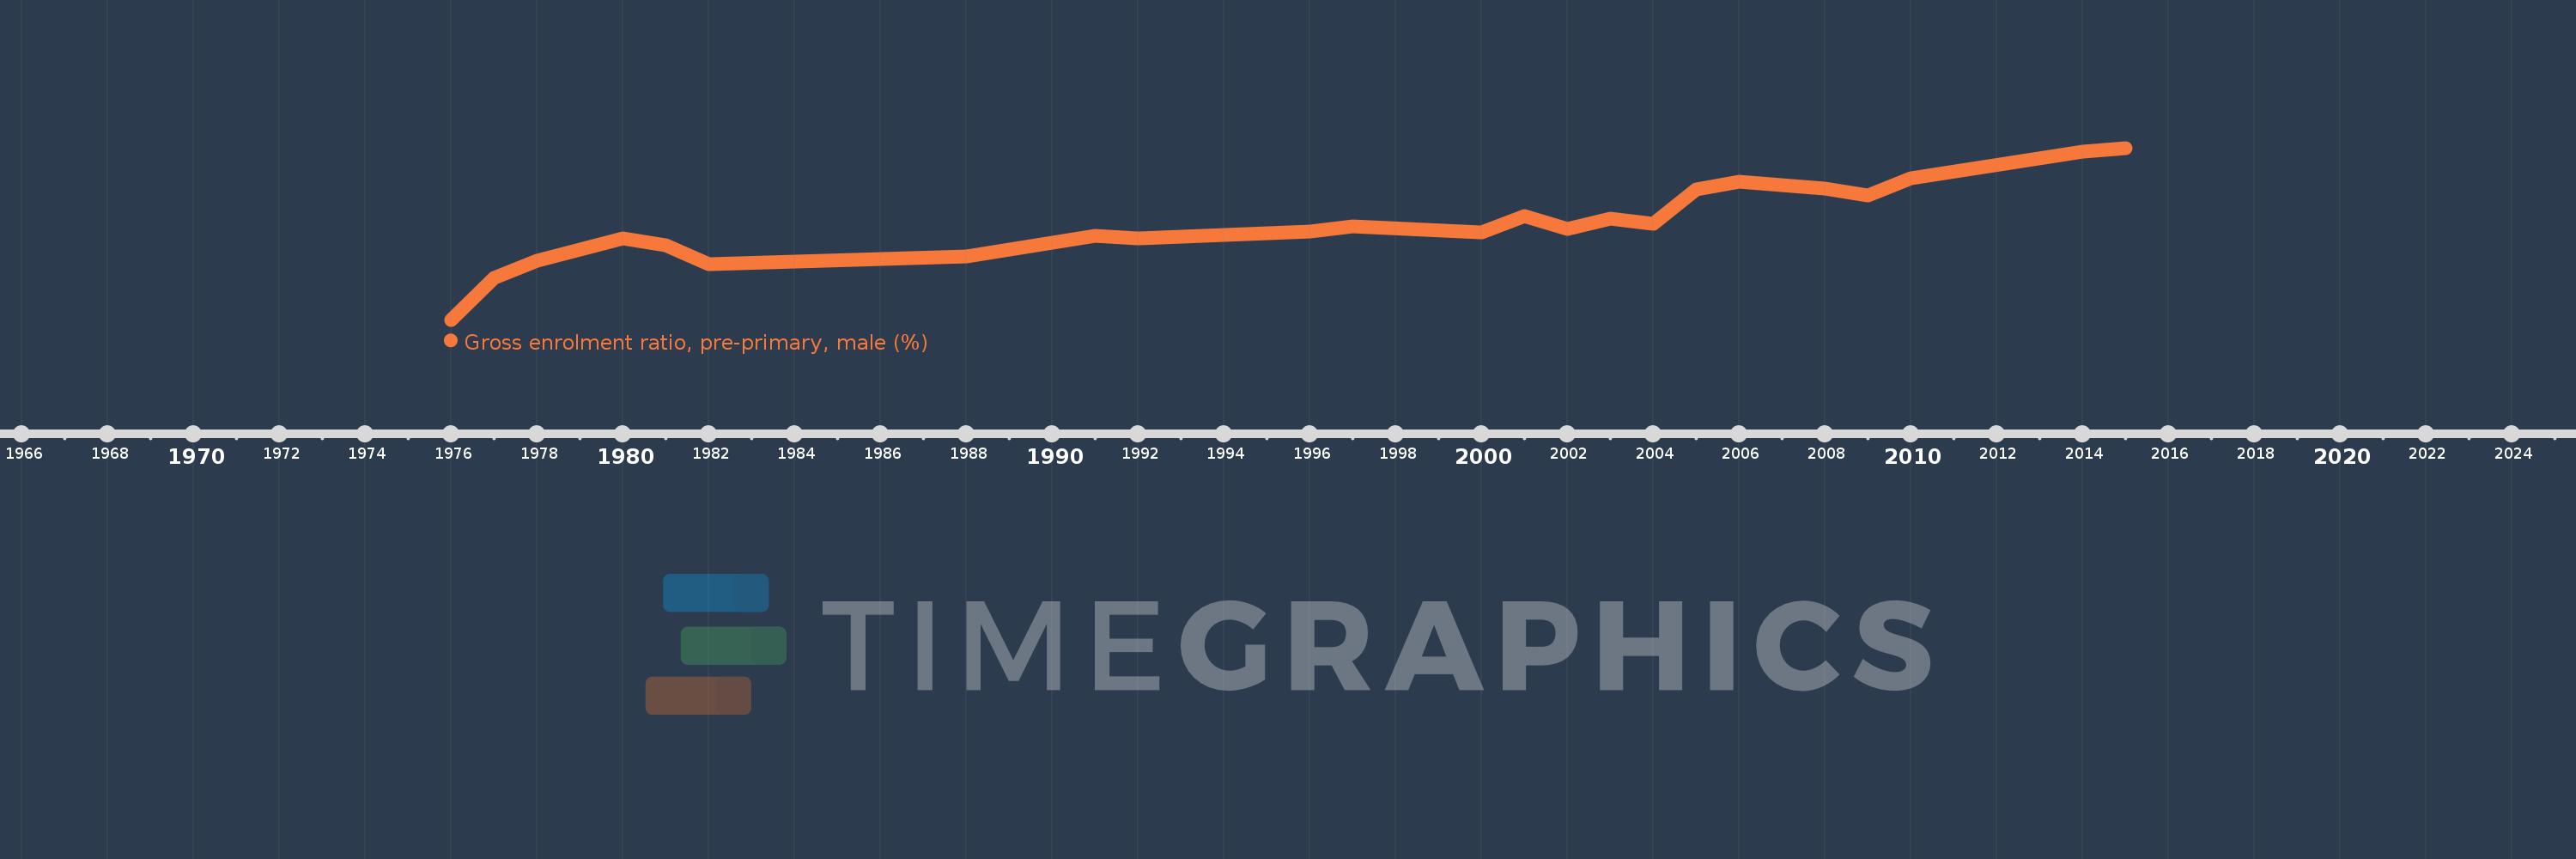
Gross enrolment ratio, pre-primary, male (%)
2015,2014,2010,2009,2008,2006,2005,2004,2003,2002,2001,2000,1997,1996,1992,1991,1988,1982,1981,1980,1978,1977,1976