33
/
AIzaSyB4mHJ5NPEv-XzF7P6NDYXjlkCWaeKw5bc
November 30, 2025
143034
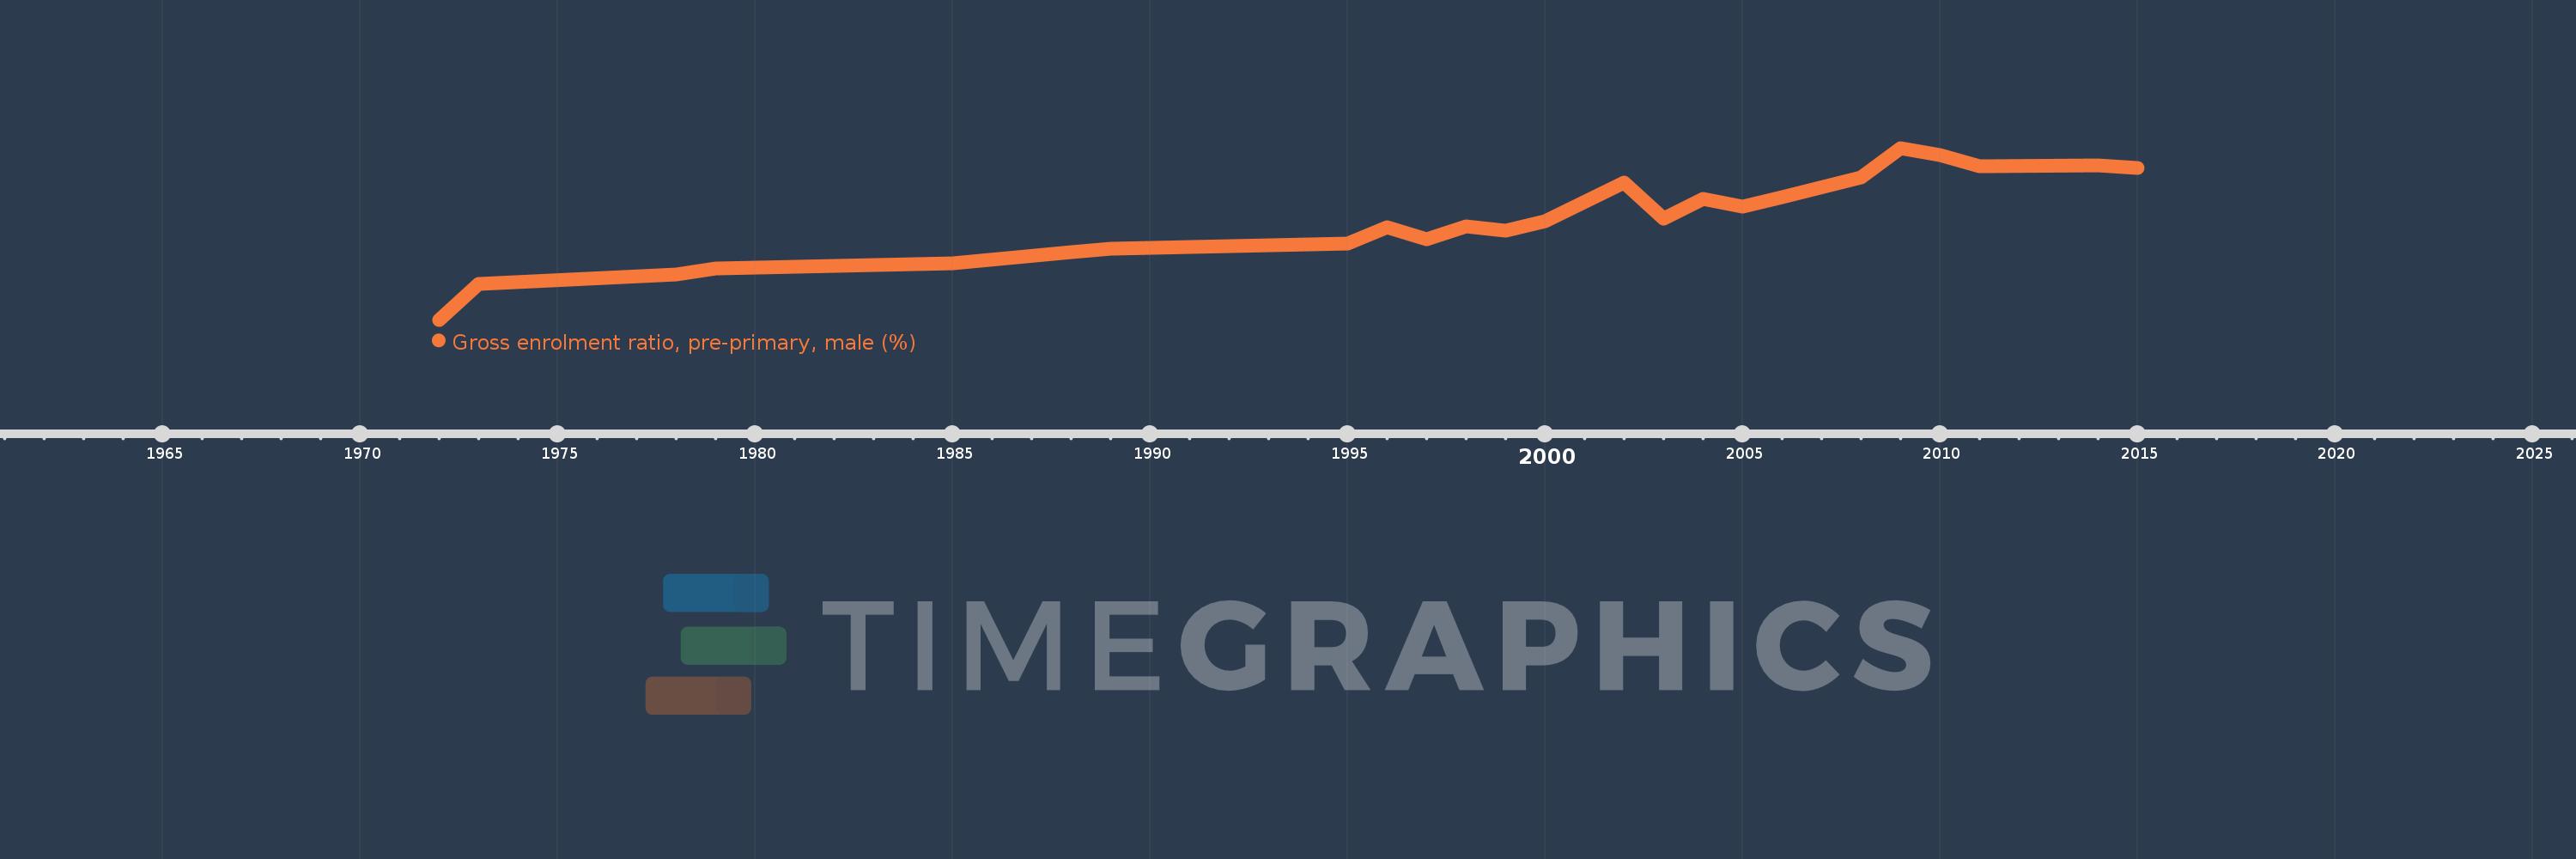
Grenada
GRD
true
2
1
Gross enrolment ratio, pre-primary, male (%)
2015,2014,2011,2010,2009,2008,2006,2005,2004,2003,2002,2000,1999,1998,1997,1996,1995,1989,1988,1985,1979,1978,1973,1972