33
/
AIzaSyB4mHJ5NPEv-XzF7P6NDYXjlkCWaeKw5bc
November 30, 2025
248782
Sri Lanka
LKA
true
2
1
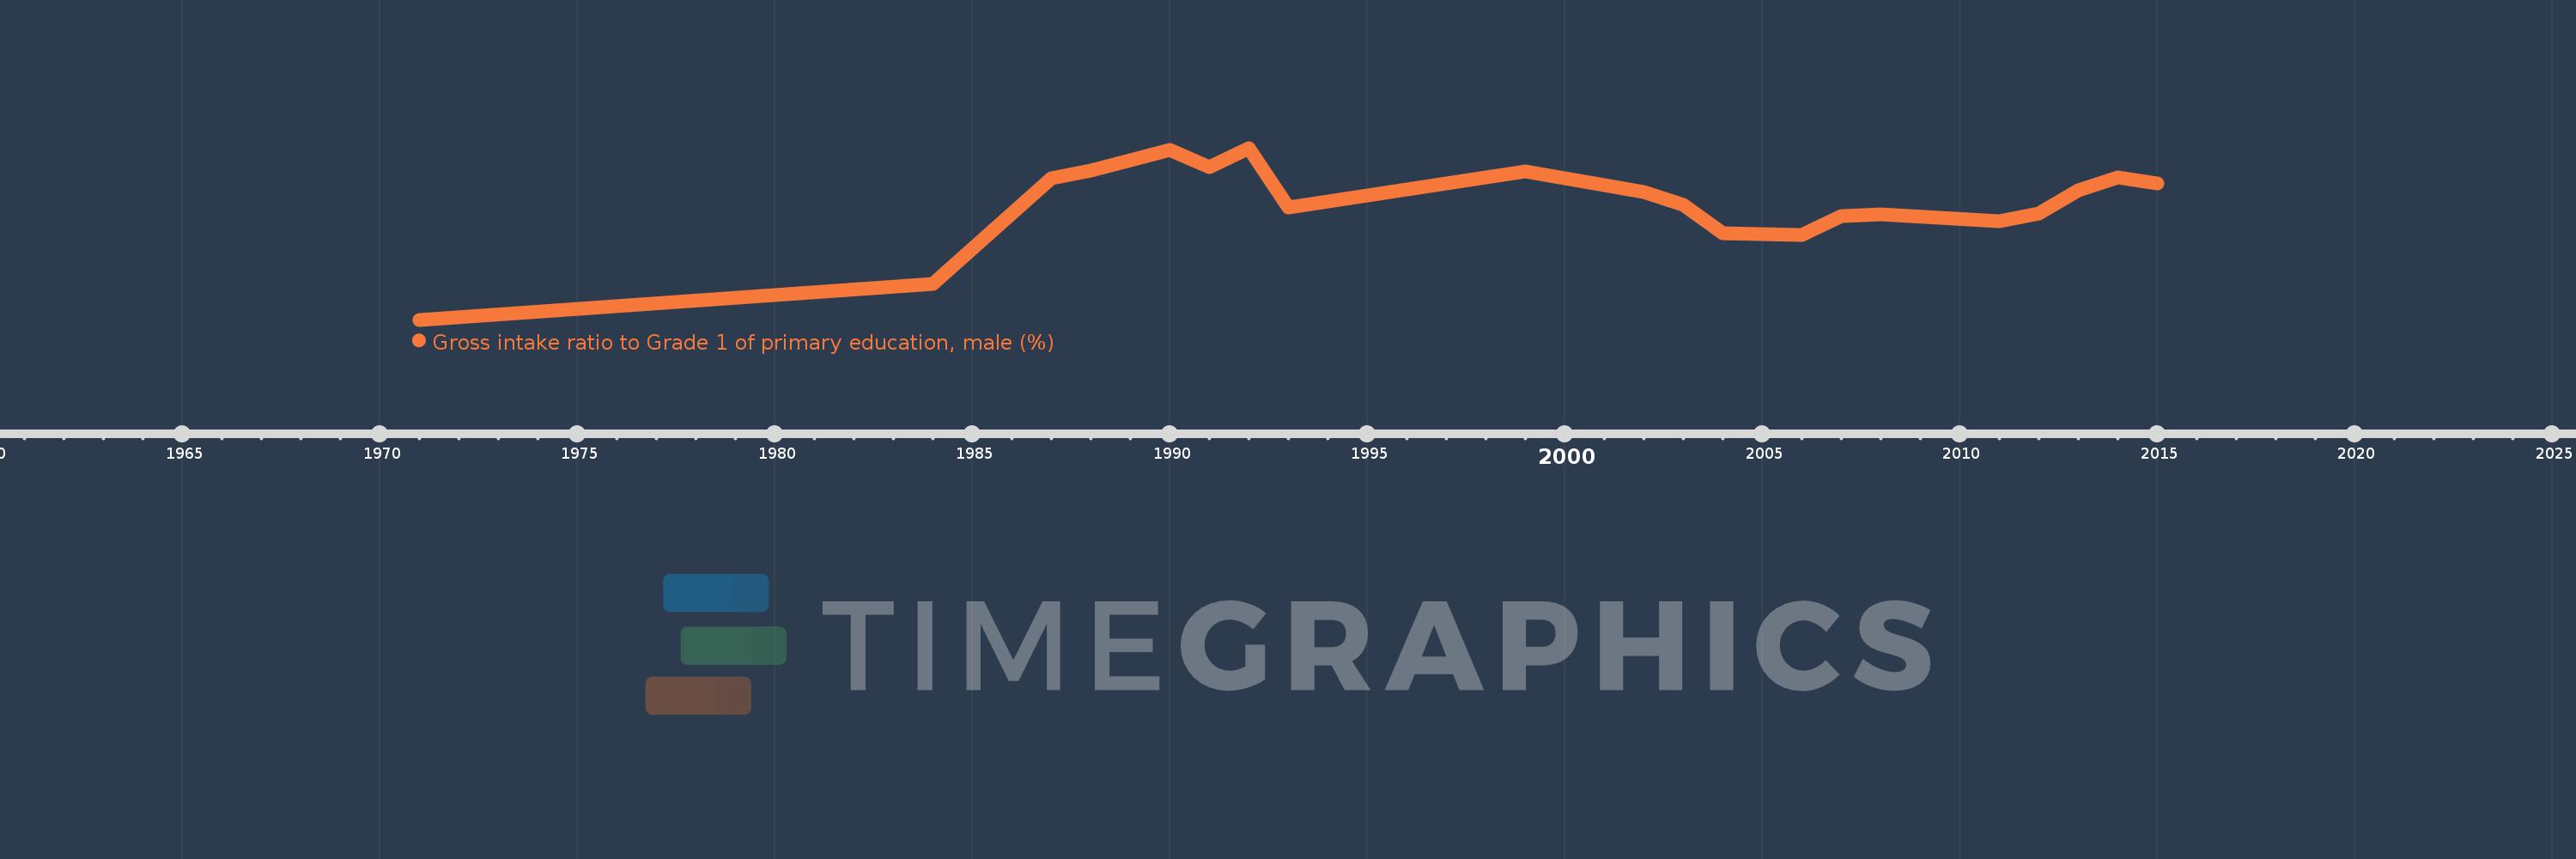
Gross intake ratio to Grade 1 of primary education, male (%)
2015,2014,2013,2012,2011,2008,2007,2006,2004,2003,2002,1999,1993,1992,1991,1990,1988,1987,1986,1984,1971