33
/
AIzaSyB4mHJ5NPEv-XzF7P6NDYXjlkCWaeKw5bc
November 30, 2025
119935
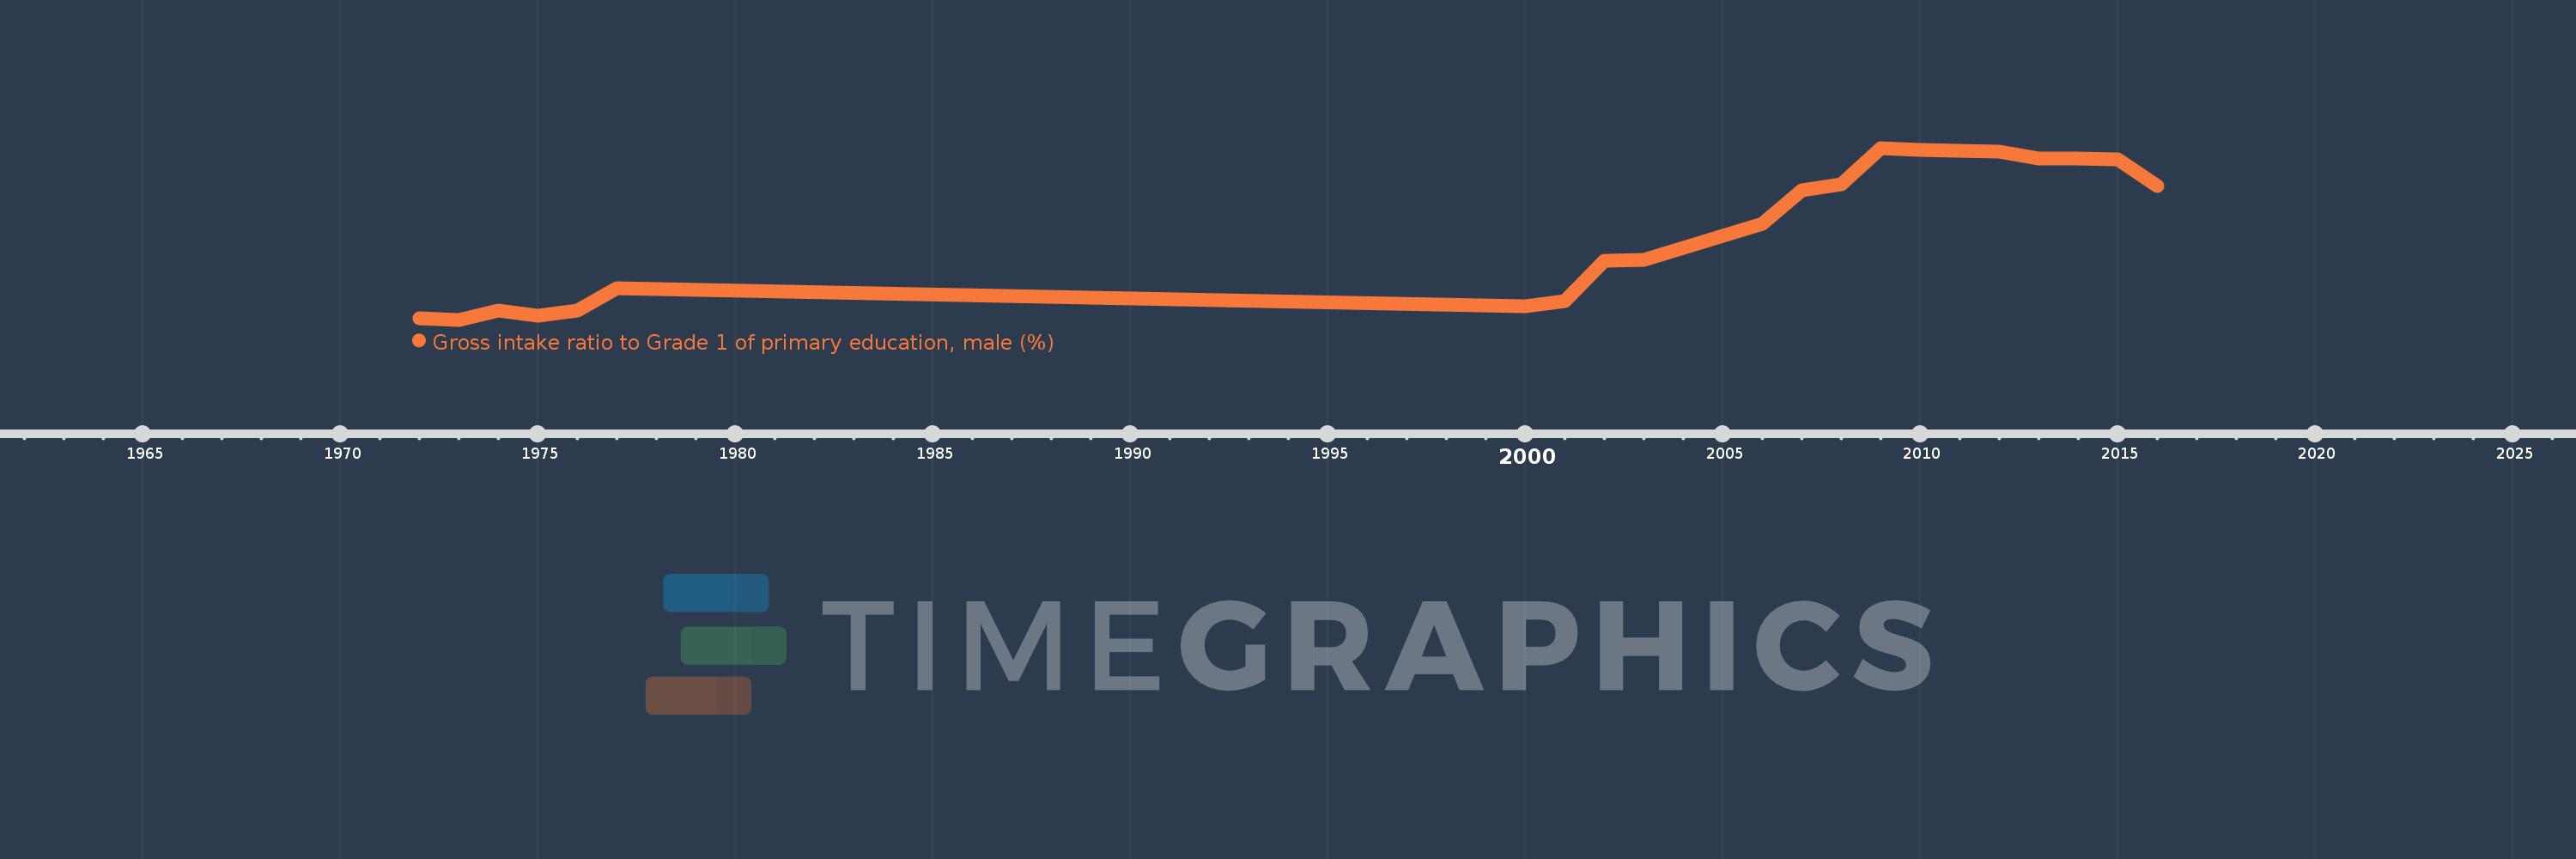
Djibouti
DJI
true
2
1
Gross intake ratio to Grade 1 of primary education, male (%)
2016,2015,2014,2013,2012,2010,2009,2008,2007,2006,2003,2002,2001,2000,1977,1976,1975,1974,1973,1972