33
/
AIzaSyB4mHJ5NPEv-XzF7P6NDYXjlkCWaeKw5bc
November 1, 2025
233670
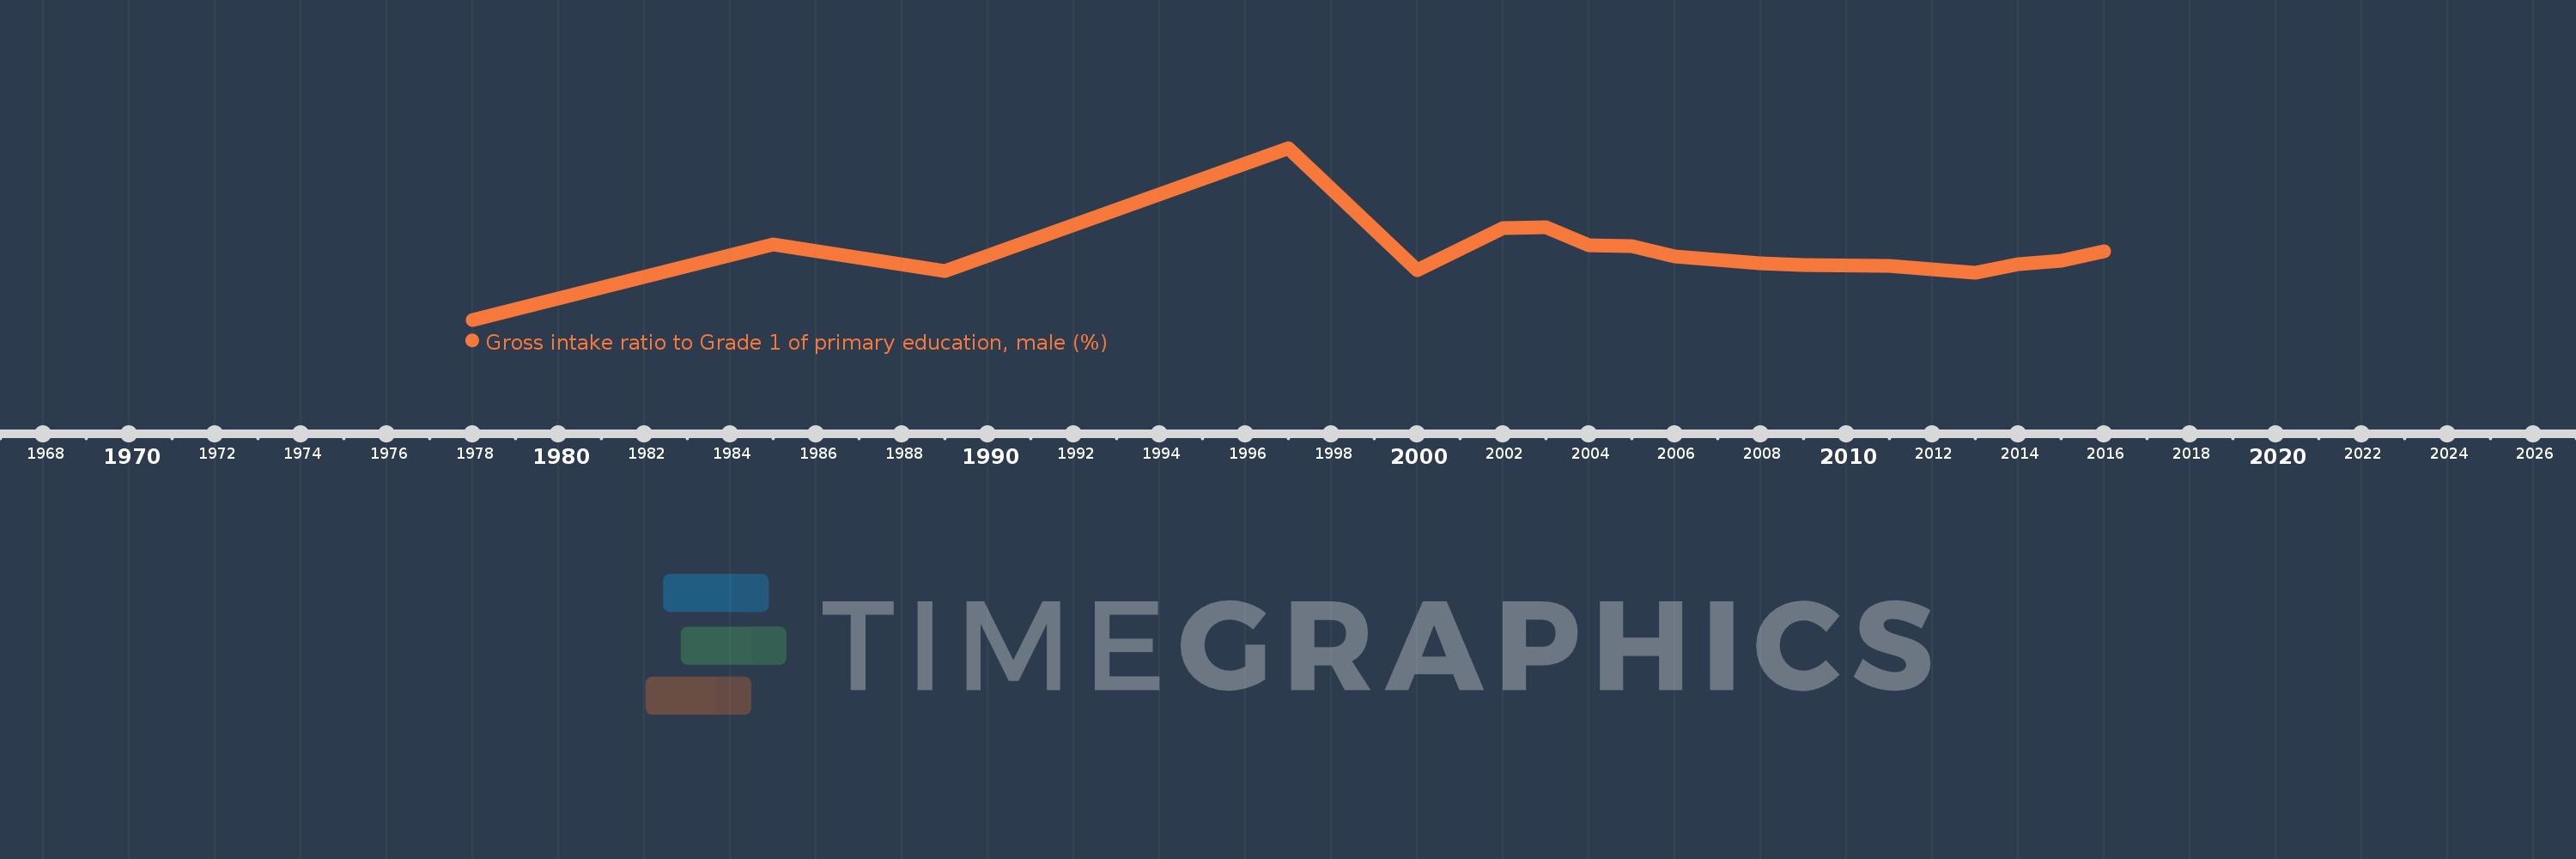
Sao Tome and Principe
STP
true
2
1
Gross intake ratio to Grade 1 of primary education, male (%)
2016,2015,2014,2013,2012,2011,2009,2008,2006,2005,2004,2003,2002,2000,1997,1989,1985,1978