33
/
AIzaSyAYiBZKx7MnpbEhh9jyipgxe19OcubqV5w
August 1, 2025
241914
Slovak Republic
SVK
true
2
1
Net bilateral aid flows from DAC donors, Total (current US$)
2005,2004,2003,2002,2001,2000,1999,1998,1997,1996,1995,1994,1993,1992,1991
Download
Global statistics library →Slovak Republic →

Net bilateral aid flows from DAC donors, Total (current US$)

This statistics in other country:

AfghanistanAlbaniaAlgeriaAngolaAntigua and BarbudaArab WorldArgentinaArmeniaArubaAzerbaijanBahamas, TheBahrainBangladeshBarbadosBelarusBelizeBeninBermudaBhutanBoliviaBosnia and HerzegovinaBotswanaBrazilBritish Virgin IslandsBrunei DarussalamBulgariaBurkina FasoBurundiCabo VerdeCambodiaCameroonCaribbean small statesCayman IslandsCentral African RepublicCentral Europe and the BalticsChadChileChinaColombiaComorosCongo, Dem. Rep.Congo, Rep.Costa RicaCote d'IvoireCroatiaCubaCyprusCzech RepublicDjiboutiDominicaDominican RepublicEast Asia & PacificEast Asia & Pacific (excluding high income)East Asia & Pacific (IDA & IBRD countries)EcuadorEgypt, Arab Rep.El SalvadorEquatorial GuineaEritreaEstoniaEthiopiaEuro areaEurope & Central AsiaEurope & Central Asia (excluding high income)Europe & Central Asia (IDA & IBRD countries)European UnionFijiFragile and conflict affected situationsFrench PolynesiaGabonGambia, TheGeorgiaGhanaGibraltarGrenadaGuatemalaGuineaGuinea-BissauGuyanaHaitiHeavily indebted poor countries (HIPC)High incomeHondurasHong Kong SAR, ChinaHungaryIBRD onlyIDA & IBRD totalIDA blendIDA onlyIDA totalIndiaIndonesiaIran, Islamic Rep.IraqIsraelJamaicaJordanKazakhstanKenyaKiribatiKorea, Dem. People’s Rep.Korea, Rep.KosovoKuwaitKyrgyz RepublicLao PDRLatin America & Caribbean Latin America & Caribbean (excluding high income)Latin America & the Caribbean (IDA & IBRD countries)LatviaLeast developed countries: UN classificationLebanonLesothoLiberiaLibyaLithuaniaLow & middle incomeLow incomeLower middle incomeMacao SAR, ChinaMacedonia, FYRMadagascarMalawiMalaysiaMaldivesMaliMaltaMarshall IslandsMauritaniaMauritiusMexicoMicronesia, Fed. Sts.Middle East & North AfricaMiddle East & North Africa (excluding high income)Middle East & North Africa (IDA & IBRD countries)Middle incomeMoldovaMongoliaMontenegroMoroccoMozambiqueMyanmarNamibiaNauruNepalNew CaledoniaNicaraguaNigerNigeriaNorth AmericaNorthern Mariana IslandsOECD membersOmanOther small statesPacific island small statesPakistanPalauPanamaPapua New GuineaParaguayPeruPhilippinesPolandQatarRomaniaRussian FederationRwandaSamoaSao Tome and PrincipeSaudi ArabiaSenegalSerbiaSeychellesSierra LeoneSingaporeSlovak RepublicSloveniaSmall statesSolomon IslandsSomaliaSouth AfricaSouth AsiaSouth Asia (IDA & IBRD)South SudanSri LankaSt. Kitts and NevisSt. LuciaSt. Vincent and the GrenadinesSub-Saharan Africa Sub-Saharan Africa (excluding high income)Sub-Saharan Africa (IDA & IBRD countries)SudanSurinameSwazilandSyrian Arab RepublicTajikistanTanzaniaThailandTimor-LesteTogoTongaTrinidad and TobagoTunisiaTurkeyTurkmenistanTurks and Caicos IslandsTuvaluUgandaUkraineUnited Arab EmiratesUpper middle incomeUruguayUzbekistanVanuatuVenezuela, RBVietnamWest Bank and GazaWorldYemen, Rep.ZambiaZimbabwe

Timeline:

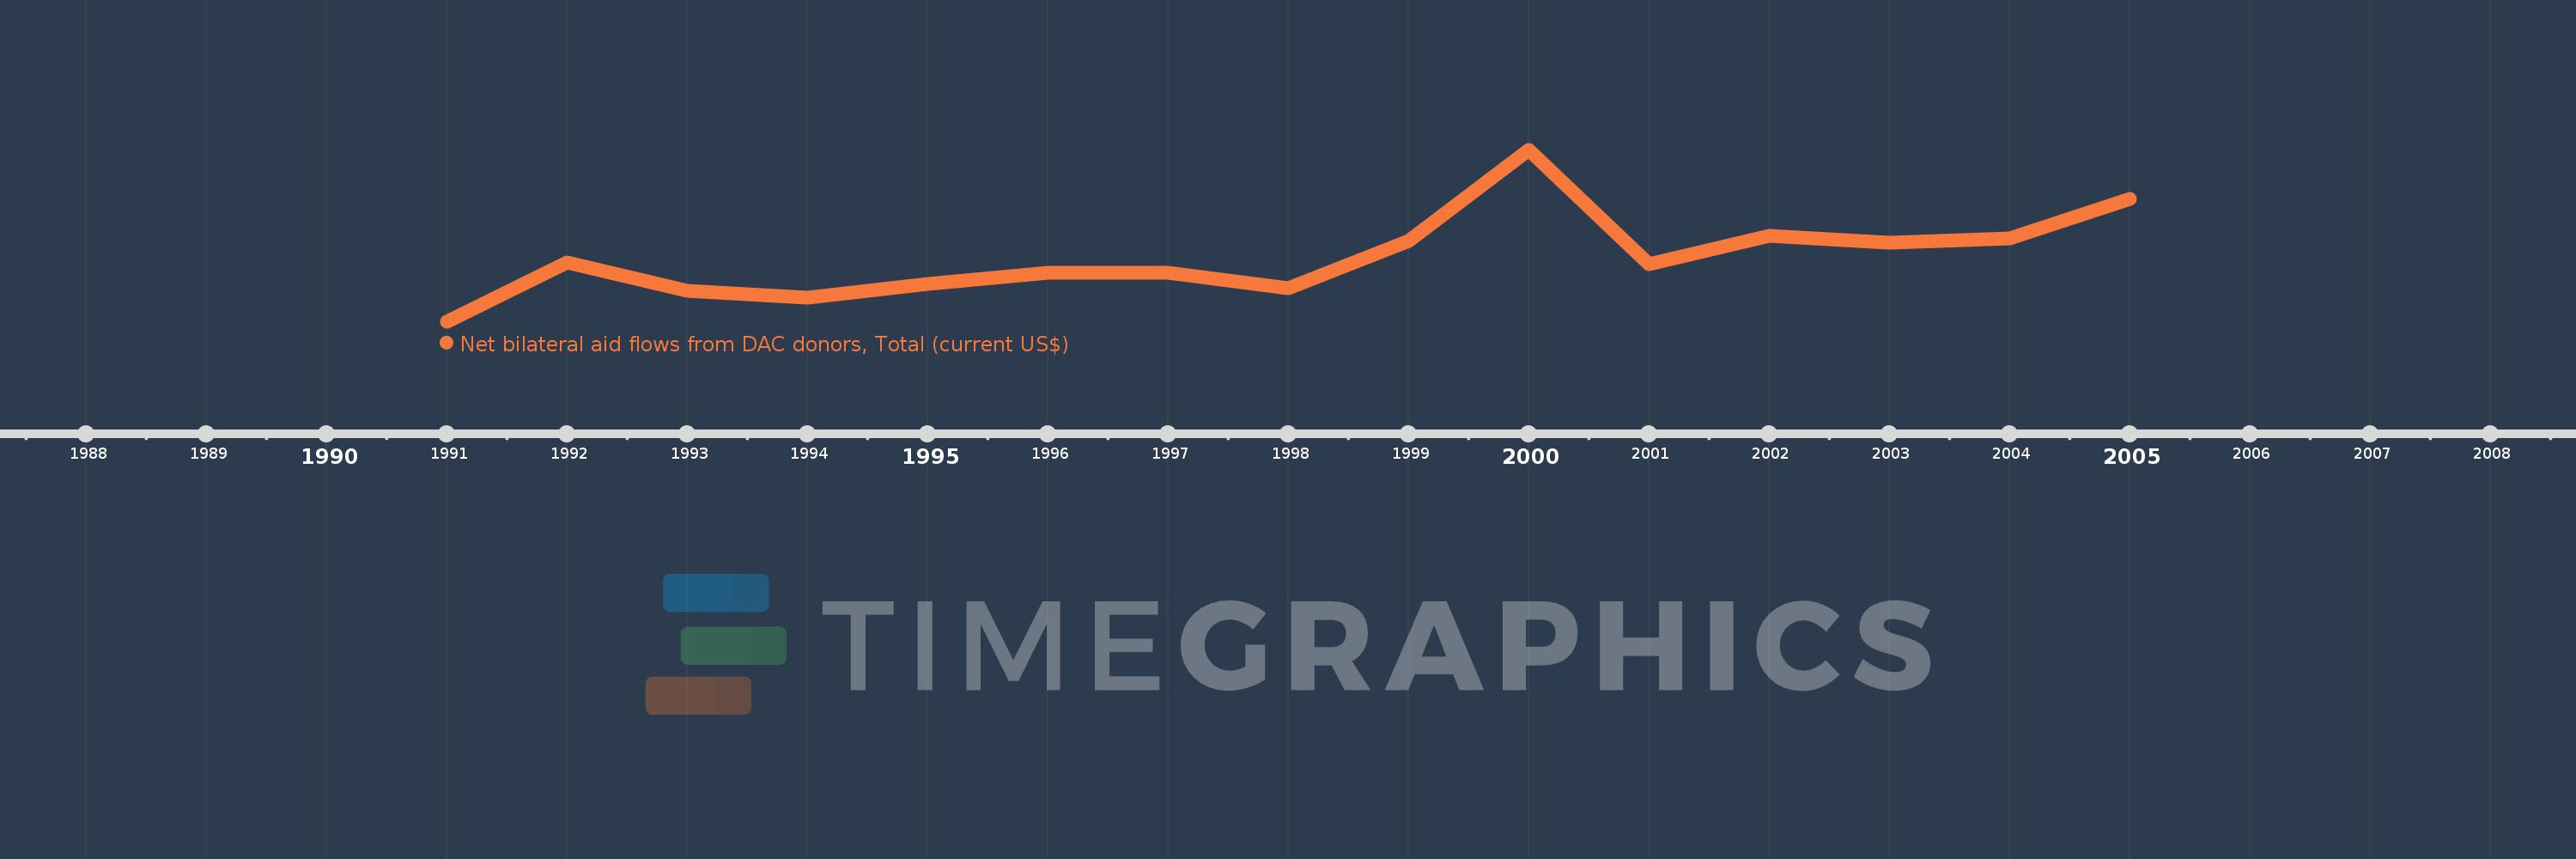
This timeline shows a graph from 1991 to 2005 of Slovak Republic. No data until 1990. Number of actual observations by date: 15.

Source name:

World Development Indicators

Source organization:

Development Assistance Committee of the Organisation for Economic Co-operation and Development, Geographical Distribution of Financial Flows to Developing Countries, Development Co-operation Report, and International Development Statistics database. Data are available online at: www.oecd.org/dac/stats/idsonline.

Categories, topics:

Aid Effectiveness

Last updated:

apr 23, 2017

Indicators value changes by year

Meaning:
122.841 mln
Minimum:
6.8 mln
jan 1, 1991
Maximum:
315.85 mln
jan 1, 2000
At the date of observation
Value
Absolute change
Change from the previous value
jan 1, 1991
6.8 mln
+6.8 mln
0.0%
jan 1, 1992
114.32 mln
+107.52 mln
1.58K%
jan 1, 1993
63.22 mln
-51.1 mln
-44.7%
jan 1, 1994
50.29 mln
-12.93 mln
-20.45%
jan 1, 1995
75.99 mln
+25.7 mln
51.1%
jan 1, 1996
95.59 mln
+19.6 mln
25.79%
jan 1, 1997
94.69 mln
-900.0K
-0.94%
jan 1, 1998
67.46 mln
-27.23 mln
-28.76%
jan 1, 1999
152.26 mln
+84.8 mln
125.7%
jan 1, 2000
315.85 mln
+163.59 mln
107.44%
jan 1, 2001
110.98 mln
-204.87 mln
-64.86%
jan 1, 2002
161.67 mln
+50.69 mln
45.67%
jan 1, 2003
149.39 mln
-12.28 mln
-7.6%
jan 1, 2004
156.63 mln
+7.24 mln
4.85%
jan 1, 2005
227.47 mln
+70.84 mln
45.23%

Ranking of countries by current statistics by years