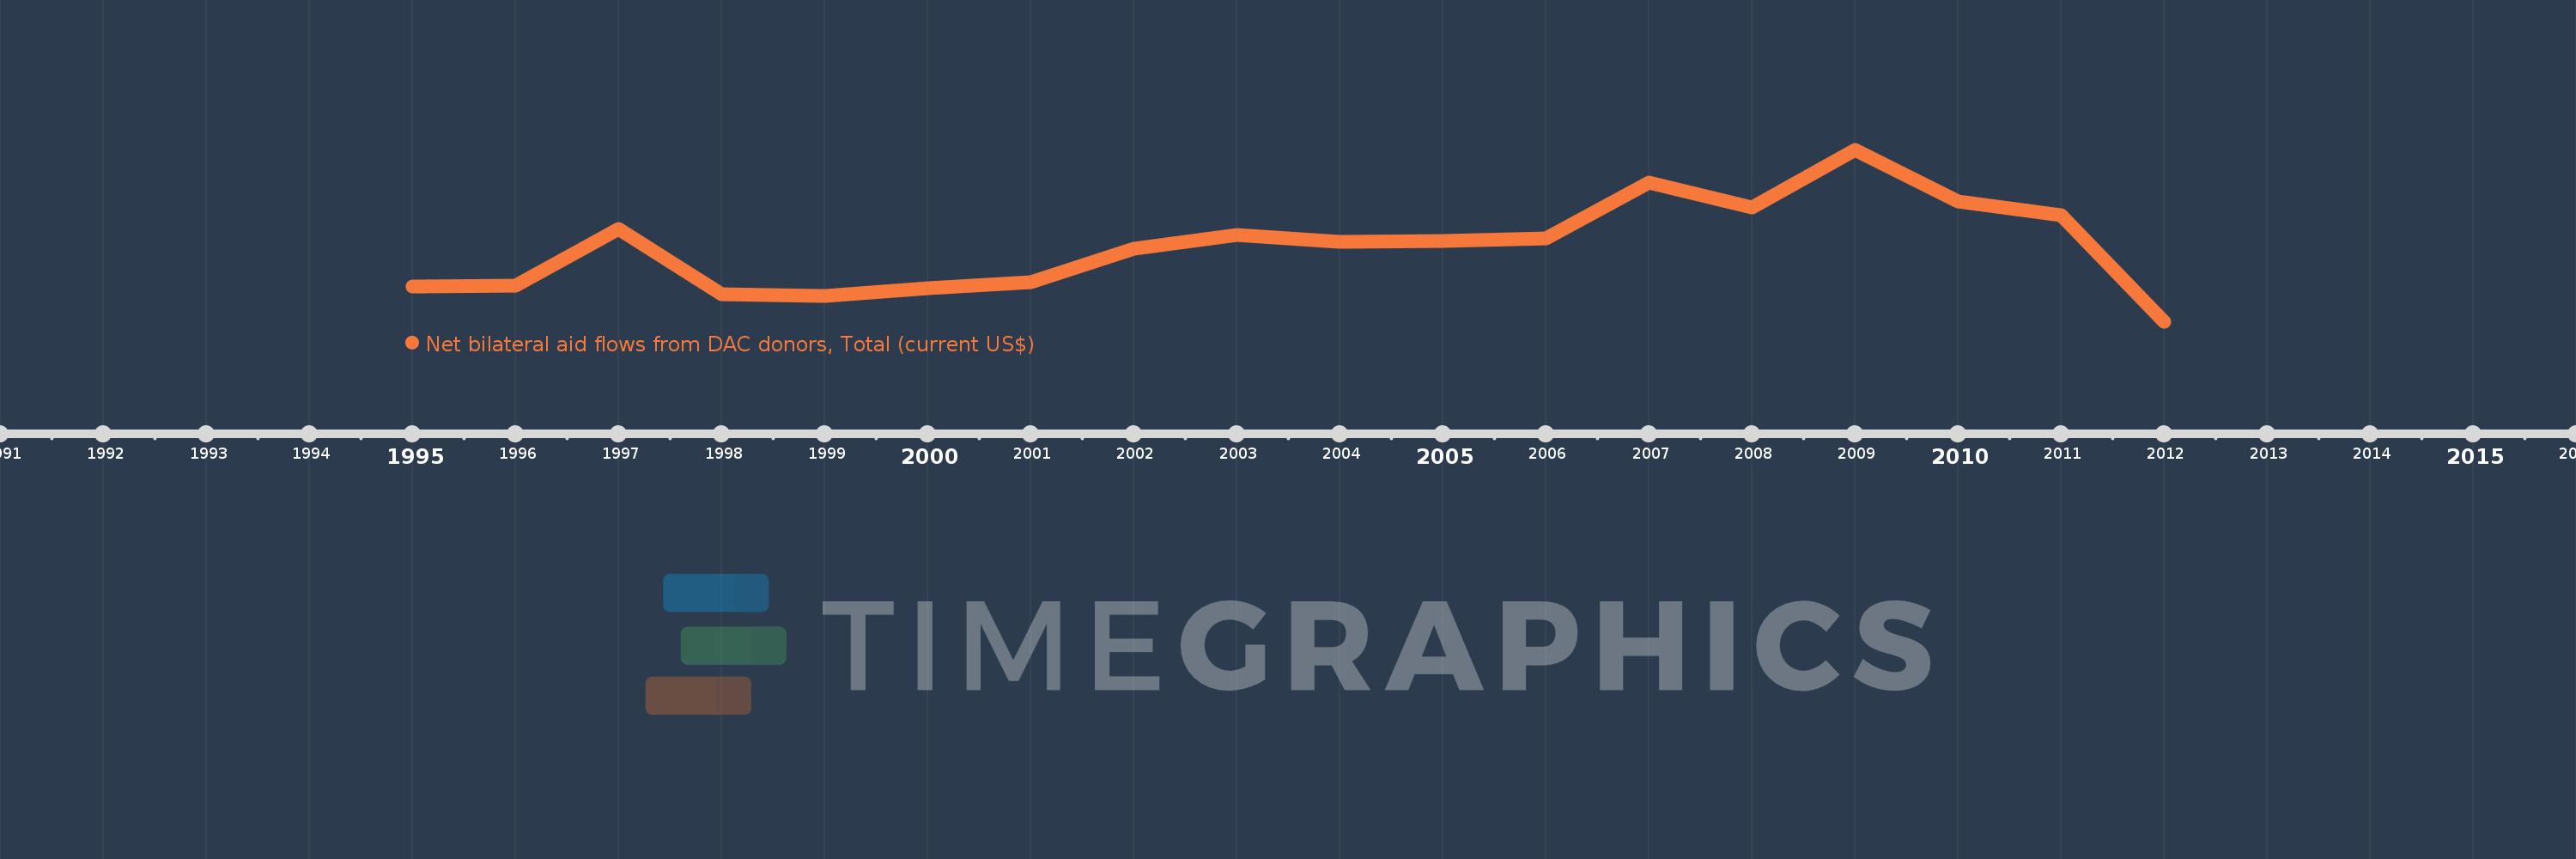
This timeline shows a graph from 1995 to 2012 of Croatia. No data until 1994. Number of actual observations by date: 18.
Source name:
World Development Indicators
Source organization:
Development Assistance Committee of the Organisation for Economic Co-operation and Development, Geographical Distribution of Financial Flows to Developing Countries, Development Co-operation Report, and International Development Statistics database. Data are available online at: www.oecd.org/dac/stats/idsonline.
Categories, topics:
Aid Effectiveness
Last updated:
apr 23, 2017
Indicators value changes by year
Meaning:
102.722 mln
Minimum:
280.0K
jan 1, 2012
Maximum:
235.08 mln
jan 1, 2009
At the date of observation
Value
Absolute change
Change from the previous value
jan 1, 1995
48.43 mln
+48.43 mln
0.0%
jan 1, 1996
50.21 mln
+1.78 mln
3.68%
jan 1, 1997
126.87 mln
+76.66 mln
152.68%
jan 1, 1998
38.51 mln
-88.36 mln
-69.65%
jan 1, 1999
36.11 mln
-2.4 mln
-6.23%
jan 1, 2000
46.29 mln
+10.18 mln
28.19%
jan 1, 2001
54.07 mln
+7.78 mln
16.81%
jan 1, 2002
100.64 mln
+46.57 mln
86.13%
jan 1, 2003
119.26 mln
+18.62 mln
18.5%
jan 1, 2004
109.98 mln
-9.28 mln
-7.78%
jan 1, 2005
111.51 mln
+1.53 mln
1.39%
jan 1, 2006
114.1 mln
+2.59 mln
2.32%
jan 1, 2007
190.46 mln
+76.36 mln
66.92%
jan 1, 2008
156.4 mln
-34.06 mln
-17.88%
jan 1, 2009
235.08 mln
+78.68 mln
50.31%
jan 1, 2010
164.91 mln
-70.17 mln
-29.85%
jan 1, 2011
145.88 mln
-19.03 mln
-11.54%
jan 1, 2012
280.0K
-145.6 mln
-99.81%
Ranking of countries by current statistics by years