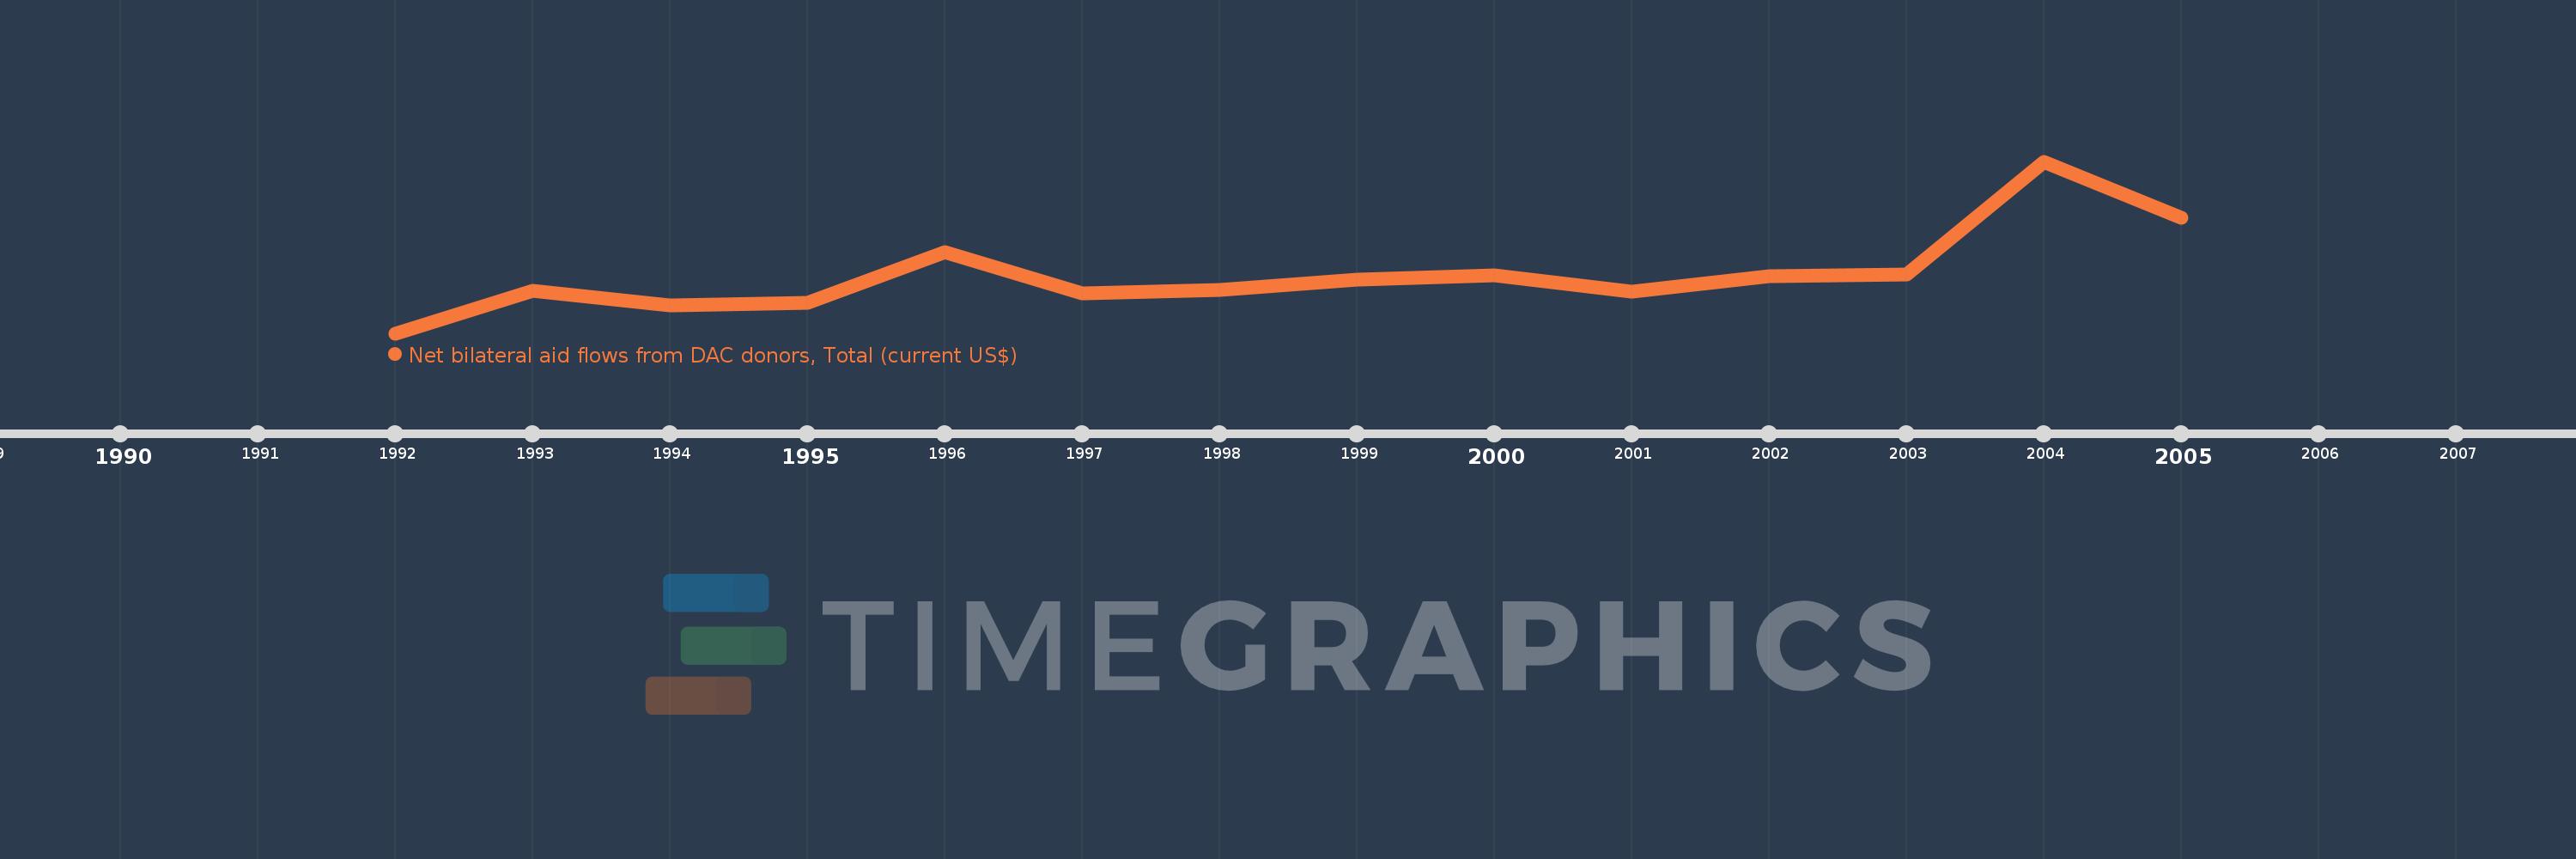
This timeline shows a graph from 1992 to 2005 of Lithuania. No data until 1991. Number of actual observations by date: 14.
Source name:
World Development Indicators
Source organization:
Development Assistance Committee of the Organisation for Economic Co-operation and Development, Geographical Distribution of Financial Flows to Developing Countries, Development Co-operation Report, and International Development Statistics database. Data are available online at: www.oecd.org/dac/stats/idsonline.
Categories, topics:
Aid Effectiveness
Last updated:
apr 23, 2017
Indicators value changes by year
Meaning:
127.743 mln
Minimum:
3.96 mln
jan 1, 1992
Maximum:
365.73 mln
jan 1, 2004
At the date of observation
Value
Absolute change
Change from the previous value
jan 1, 1992
3.96 mln
+3.96 mln
0.0%
jan 1, 1993
93.72 mln
+89.76 mln
2.27K%
jan 1, 1994
61.89 mln
-31.83 mln
-33.96%
jan 1, 1995
68.48 mln
+6.59 mln
10.65%
jan 1, 1996
175.71 mln
+107.23 mln
156.59%
jan 1, 1997
87.78 mln
-87.93 mln
-50.04%
jan 1, 1998
94.75 mln
+6.97 mln
7.94%
jan 1, 1999
117.36 mln
+22.61 mln
23.86%
jan 1, 2000
126.59 mln
+9.23 mln
7.86%
jan 1, 2001
91.94 mln
-34.65 mln
-27.37%
jan 1, 2002
124.89 mln
+32.95 mln
35.84%
jan 1, 2003
128.09 mln
+3.2 mln
2.56%
jan 1, 2004
365.73 mln
+237.64 mln
185.53%
jan 1, 2005
247.51 mln
-118.22 mln
-32.32%
Ranking of countries by current statistics by years