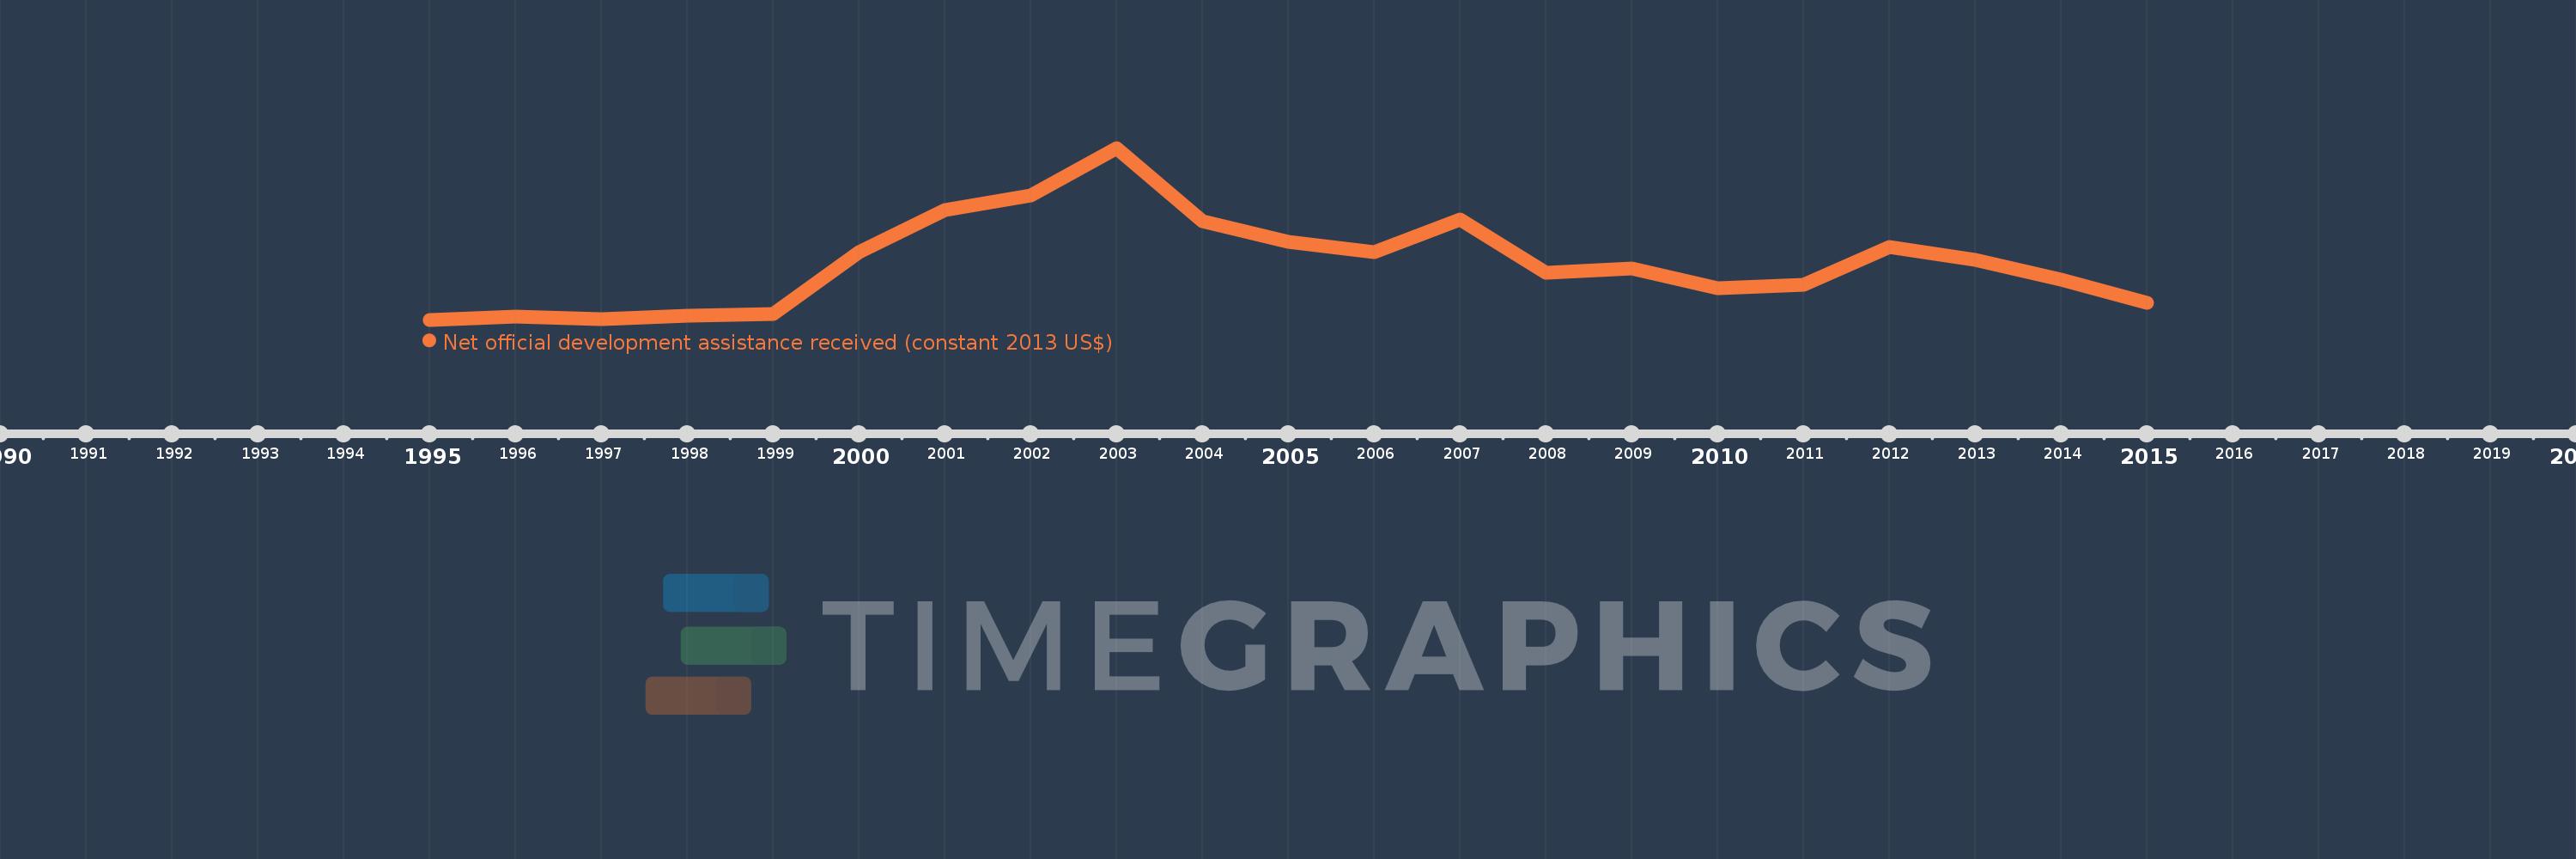
This timeline shows a graph from 1995 to 2015 of Serbia. No data until 1994. Number of actual observations by date: 21.
Source name:
World Development Indicators
Source organization:
Development Assistance Committee of the Organisation for Economic Co-operation and Development, Geographical Distribution of Financial Flows to Developing Countries, Development Co-operation Report, and International Development Statistics database. Data are available online at: www.oecd.org/dac/stats/idsonline.
Categories, topics:
Aid Effectiveness
Last updated:
apr 23, 2017
Indicators value changes by year
Meaning:
1.072 bln
Minimum:
80.16 mln
jan 1, 1995
Maximum:
3.104 bln
jan 1, 2003
At the date of observation
Value
Absolute change
Change from the previous value
jan 1, 1995
80.16 mln
+80.16 mln
0.0%
jan 1, 1996
129.48 mln
+49.32 mln
61.53%
jan 1, 1997
91.01 mln
-38.47 mln
-29.71%
jan 1, 1998
149.54 mln
+58.53 mln
64.31%
jan 1, 1999
174.49 mln
+24.95 mln
16.68%
jan 1, 2000
1.265 bln
+1.091 bln
625.08%
jan 1, 2001
2.008 bln
+743.08 mln
58.73%
jan 1, 2002
2.265 bln
+256.92 mln
12.79%
jan 1, 2003
3.104 bln
+838.83 mln
37.03%
jan 1, 2004
1.814 bln
-1.29 bln
-41.57%
jan 1, 2005
1.451 bln
-362.2 mln
-19.97%
jan 1, 2006
1.269 bln
-182.83 mln
-12.6%
jan 1, 2007
1.85 bln
+581.33 mln
45.82%
jan 1, 2008
911.58 mln
-938.41 mln
-50.73%
jan 1, 2009
983.67 mln
+72.09 mln
7.91%
jan 1, 2010
641.38 mln
-342.29 mln
-34.8%
jan 1, 2011
691.85 mln
+50.47 mln
7.87%
jan 1, 2012
1.356 bln
+664.23 mln
96.01%
jan 1, 2013
1.134 bln
-222.16 mln
-16.38%
jan 1, 2014
780.29 mln
-353.63 mln
-31.19%
jan 1, 2015
371.93 mln
-408.36 mln
-52.33%
Ranking of countries by current statistics by years