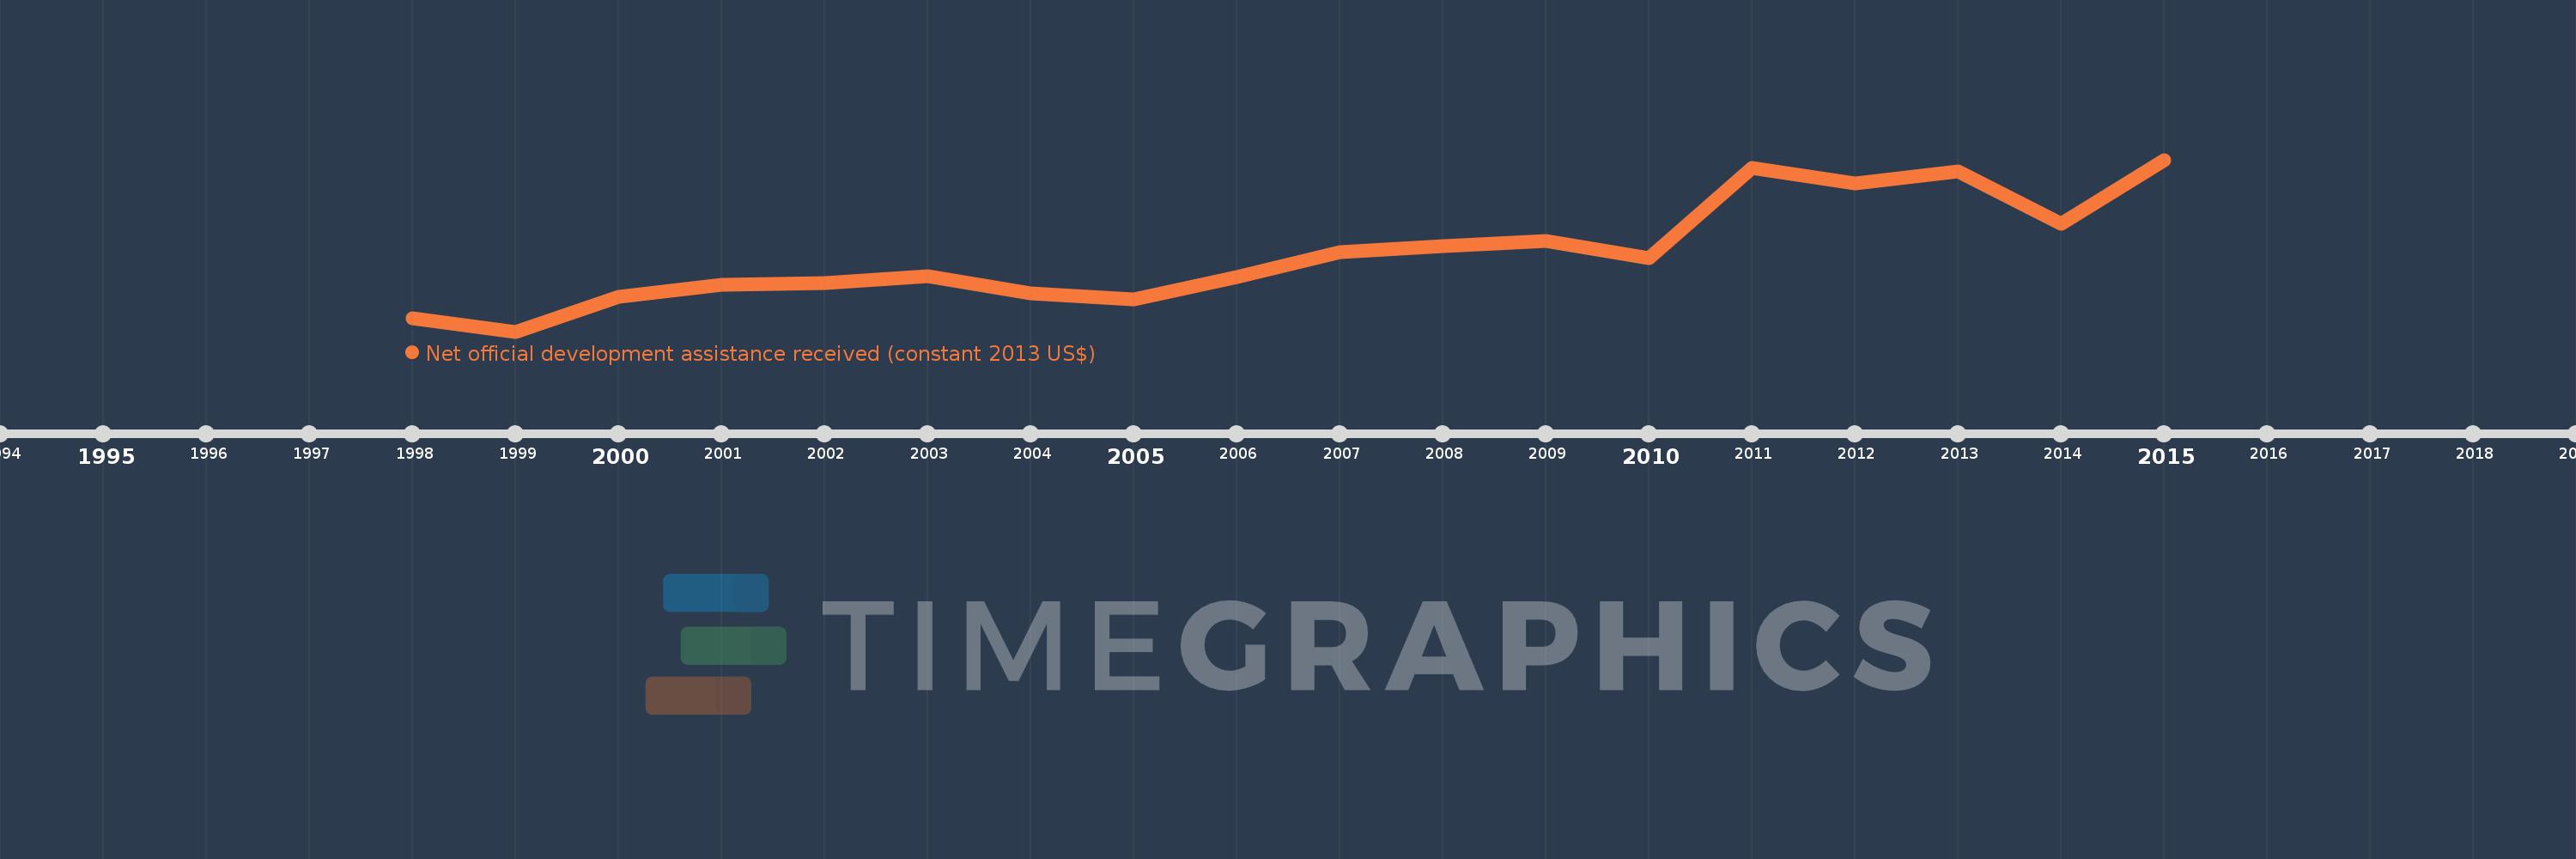
This timeline shows a graph from 1998 to 2015 of Moldova. No data until 1997. Number of actual observations by date: 18.
Source name:
World Development Indicators
Source organization:
Development Assistance Committee of the Organisation for Economic Co-operation and Development, Geographical Distribution of Financial Flows to Developing Countries, Development Co-operation Report, and International Development Statistics database. Data are available online at: www.oecd.org/dac/stats/idsonline.
Categories, topics:
Aid Effectiveness
Last updated:
apr 23, 2017
Indicators value changes by year
Meaning:
266.784 mln
Minimum:
59.6 mln
jan 1, 1999
Maximum:
515.81 mln
jan 1, 2015
At the date of observation
Value
Absolute change
Change from the previous value
jan 1, 1998
94.49 mln
+94.49 mln
0.0%
jan 1, 1999
59.6 mln
-34.89 mln
-36.92%
jan 1, 2000
151.91 mln
+92.31 mln
154.88%
jan 1, 2001
183.88 mln
+31.97 mln
21.05%
jan 1, 2002
187.39 mln
+3.51 mln
1.91%
jan 1, 2003
206.07 mln
+18.68 mln
9.97%
jan 1, 2004
161.75 mln
-44.32 mln
-21.51%
jan 1, 2005
146.07 mln
-15.68 mln
-9.69%
jan 1, 2006
204.02 mln
+57.95 mln
39.67%
jan 1, 2007
269.53 mln
+65.51 mln
32.11%
jan 1, 2008
285.77 mln
+16.24 mln
6.03%
jan 1, 2009
301.35 mln
+15.58 mln
5.45%
jan 1, 2010
254.49 mln
-46.86 mln
-15.55%
jan 1, 2011
494.19 mln
+239.7 mln
94.19%
jan 1, 2012
453.11 mln
-41.08 mln
-8.31%
jan 1, 2013
486.1 mln
+32.99 mln
7.28%
jan 1, 2014
346.59 mln
-139.51 mln
-28.7%
jan 1, 2015
515.81 mln
+169.22 mln
48.82%
Ranking of countries by current statistics by years