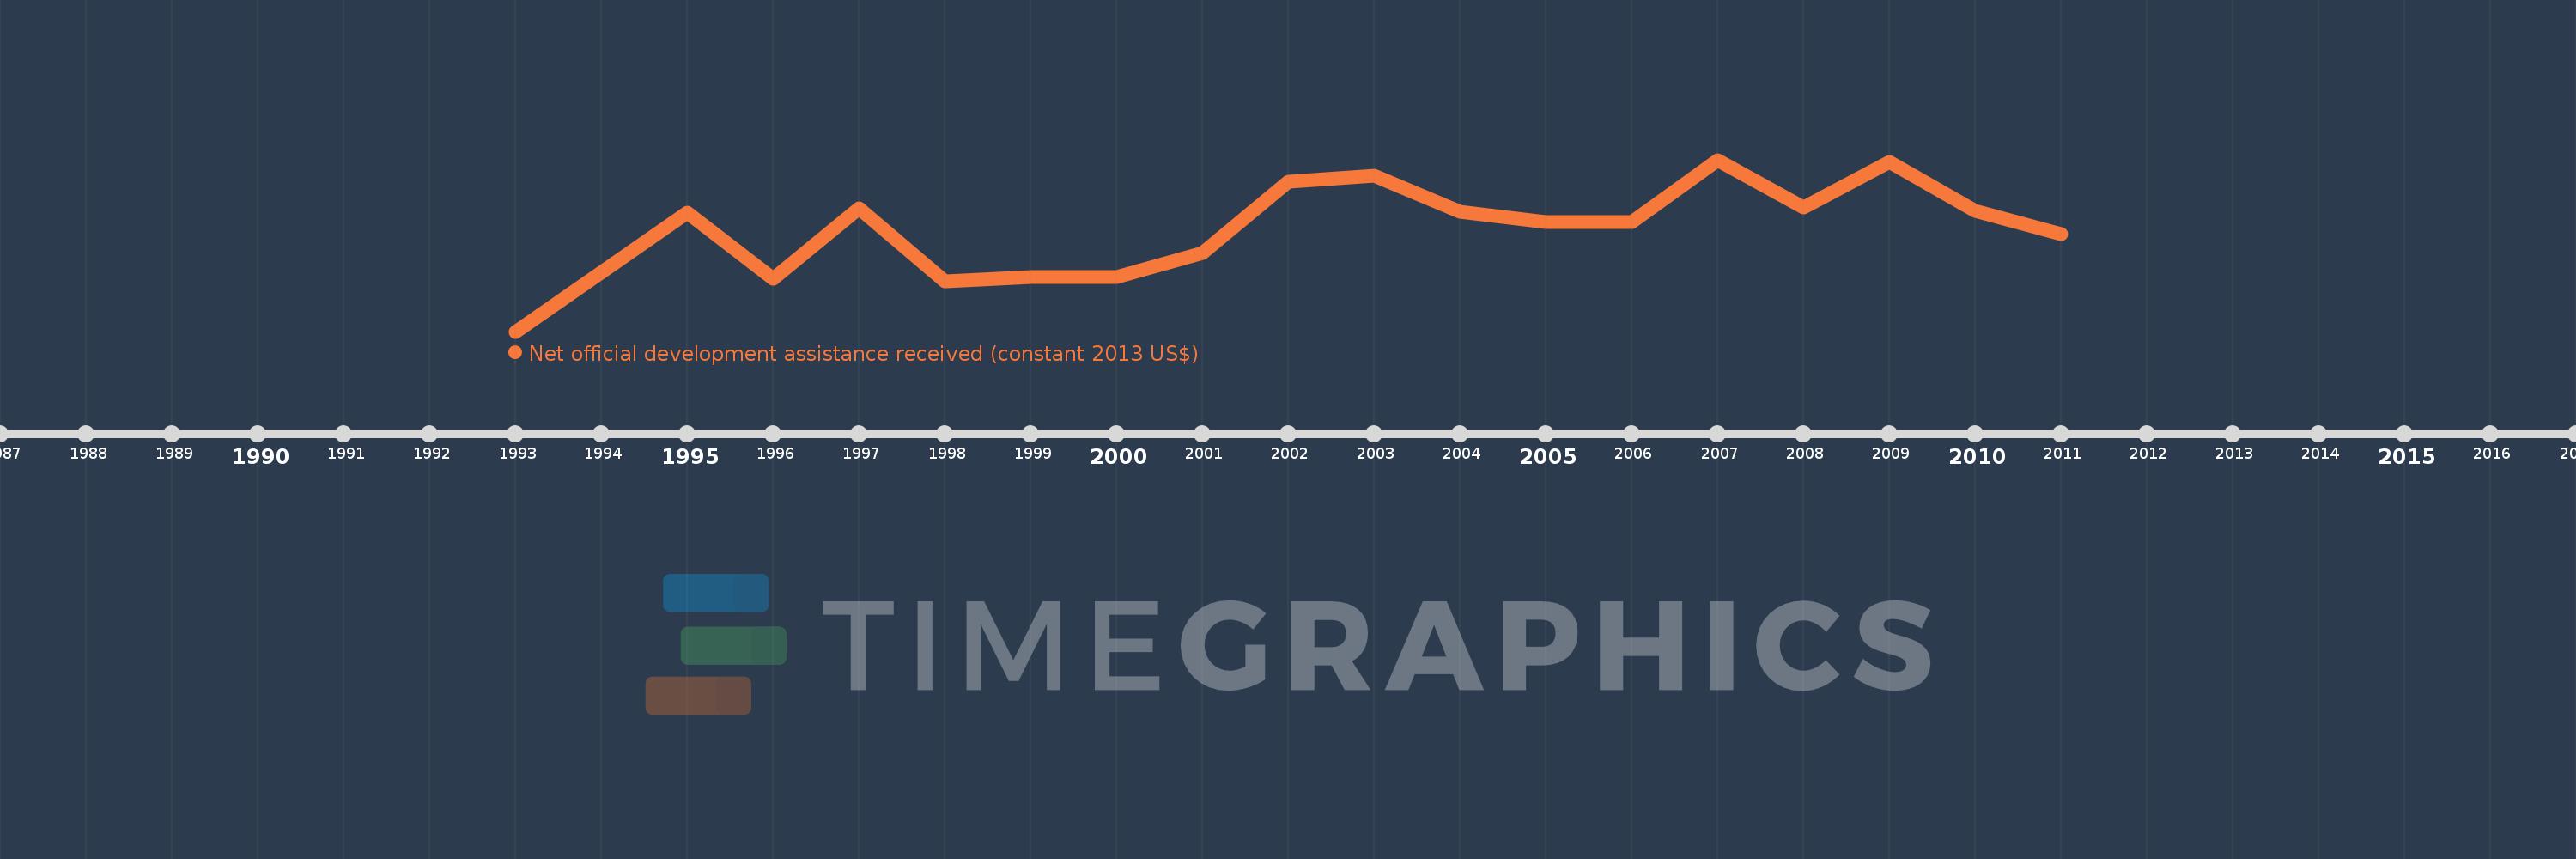
This timeline shows a graph from 1993 to 2011 of Croatia. No data until 1992. Number of actual observations by date: 18.
Source name:
World Development Indicators
Source organization:
Development Assistance Committee of the Organisation for Economic Co-operation and Development, Geographical Distribution of Financial Flows to Developing Countries, Development Co-operation Report, and International Development Statistics database. Data are available online at: www.oecd.org/dac/stats/idsonline.
Categories, topics:
Aid Effectiveness
Last updated:
apr 23, 2017
Indicators value changes by year
Meaning:
144.79 mln
Minimum:
20.0K
jan 1, 1993
Maximum:
240.58 mln
jan 1, 2007
At the date of observation
Value
Absolute change
Change from the previous value
jan 1, 1993
20.0K
+20.0K
0.0%
jan 1, 1995
166.77 mln
+166.75 mln
833.75K%
jan 1, 1996
73.56 mln
-93.21 mln
-55.89%
jan 1, 1997
172.45 mln
+98.89 mln
134.43%
jan 1, 1998
69.95 mln
-102.5 mln
-59.44%
jan 1, 1999
75.92 mln
+5.97 mln
8.53%
jan 1, 2000
76.83 mln
+910.0K
1.2%
jan 1, 2001
109.72 mln
+32.89 mln
42.81%
jan 1, 2002
210.4 mln
+100.68 mln
91.76%
jan 1, 2003
218.11 mln
+7.71 mln
3.66%
jan 1, 2004
167.93 mln
-50.18 mln
-23.01%
jan 1, 2005
153.79 mln
-14.14 mln
-8.42%
jan 1, 2006
153.0 mln
-790.0K
-0.51%
jan 1, 2007
240.58 mln
+87.58 mln
57.24%
jan 1, 2008
173.75 mln
-66.83 mln
-27.78%
jan 1, 2009
237.02 mln
+63.27 mln
36.41%
jan 1, 2010
169.58 mln
-67.44 mln
-28.45%
jan 1, 2011
136.84 mln
-32.74 mln
-19.31%
Ranking of countries by current statistics by years