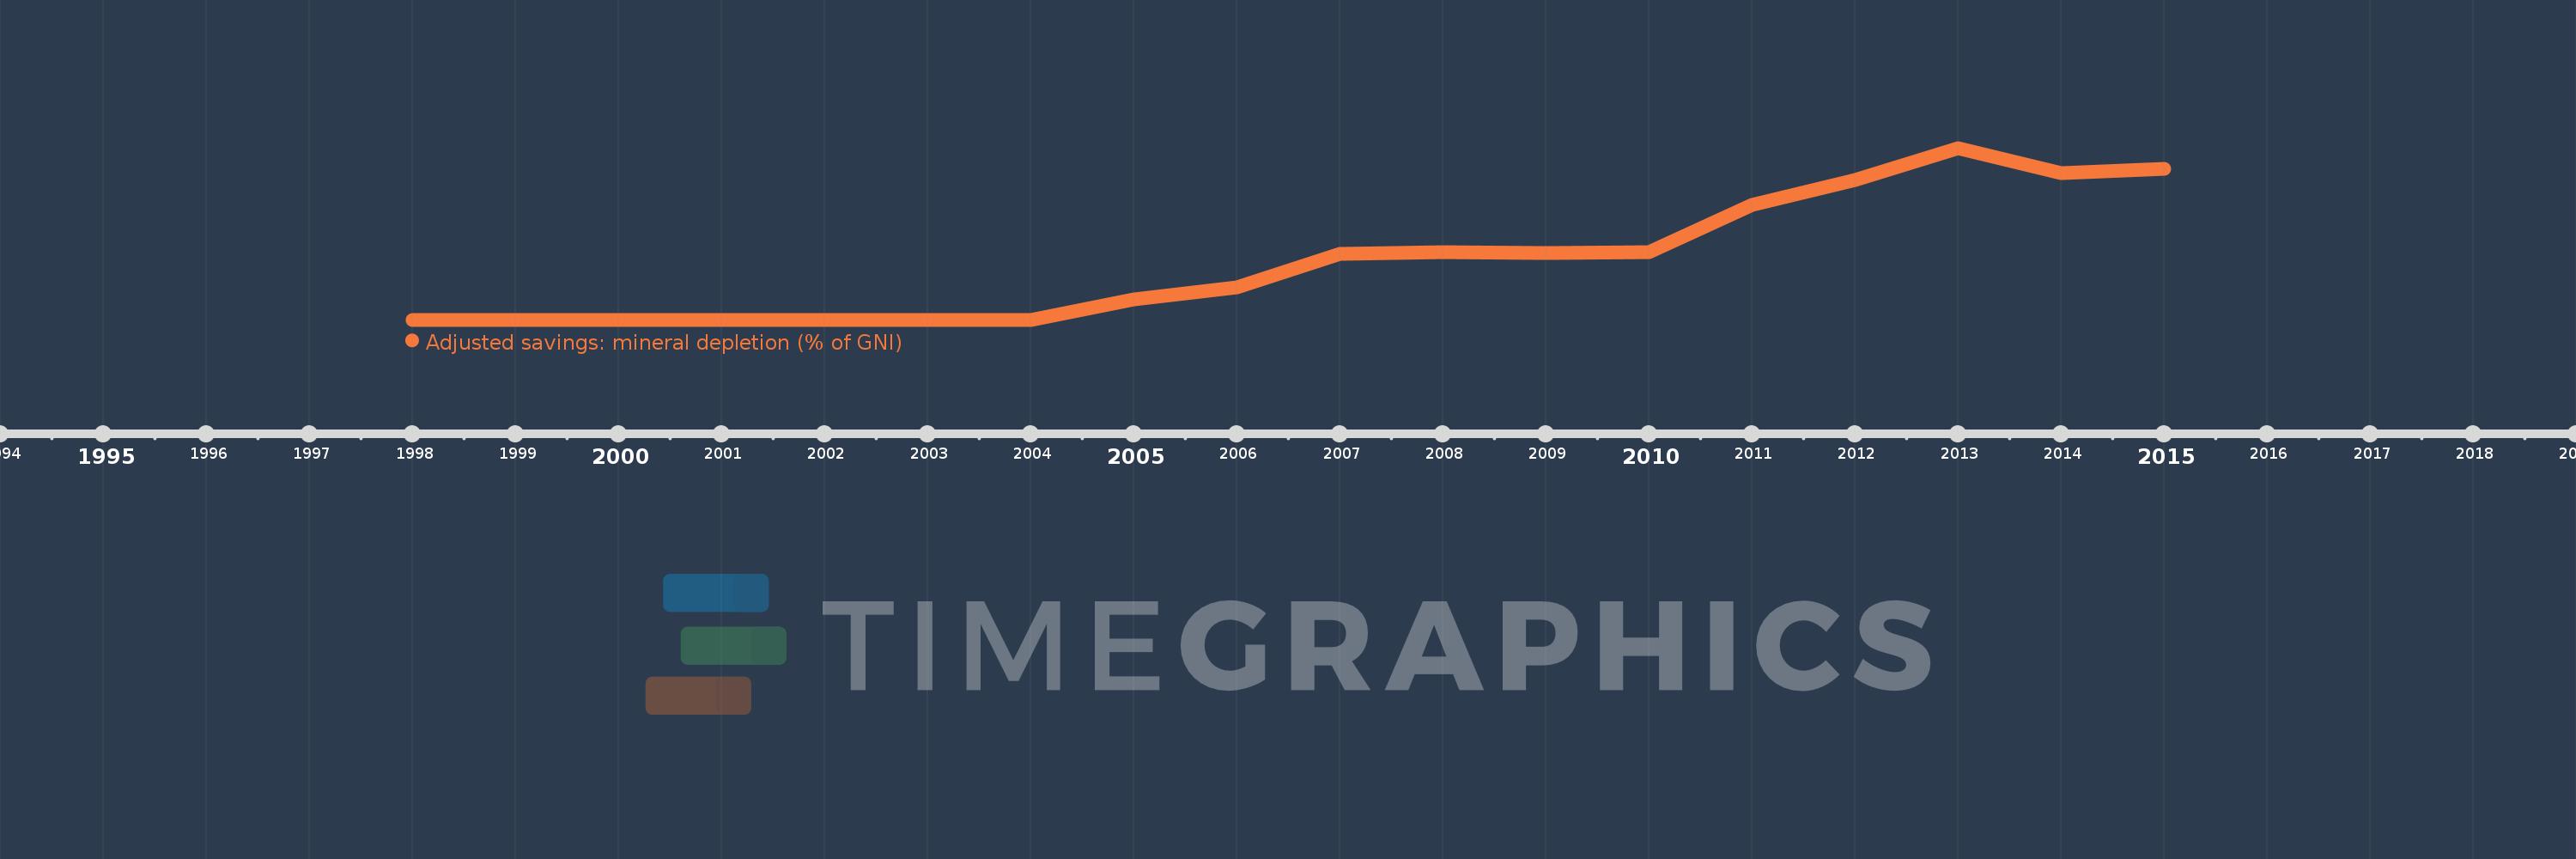
This timeline shows a graph from 1998 to 2015 of Serbia. No data until 1997. Number of actual observations by date: 18.
Source name:
World Development Indicators
Source organization:
World Bank staff estimates based on sources and methods in World Bank's "The Changing Wealth of Nations: Measuring Sustainable Development in the New Millennium" (2011).
Categories, topics:
Economy & Growth, Energy & Mining, Environment
Last updated:
apr 23, 2017
Indicators value changes by year
Meaning:
0.117
Minimum:
0.0
jan 1, 1998
Maximum:
0.346
jan 1, 2013
At the date of observation
Value
Absolute change
Change from the previous value
jan 1, 1998
0.0
0.0
0.0%
jan 1, 1999
0.0
0.0
%
jan 1, 2000
0.0
0.0
%
jan 1, 2001
0.0
0.0
%
jan 1, 2002
0.0
0.0
%
jan 1, 2003
0.0
0.0
%
jan 1, 2004
0.0
0.0
%
jan 1, 2005
0.041
+0.041
%
jan 1, 2006
0.066
+0.025
62.45%
jan 1, 2007
0.132
+0.066
99.27%
jan 1, 2008
0.136
+0.004
2.77%
jan 1, 2009
0.134
-0.001
-0.82%
jan 1, 2010
0.136
+0.001
0.9%
jan 1, 2011
0.231
+0.096
70.57%
jan 1, 2012
0.281
+0.049
21.27%
jan 1, 2013
0.346
+0.065
23.3%
jan 1, 2014
0.295
-0.051
-14.8%
jan 1, 2015
0.304
+0.009
3.06%
Ranking of countries by current statistics by years