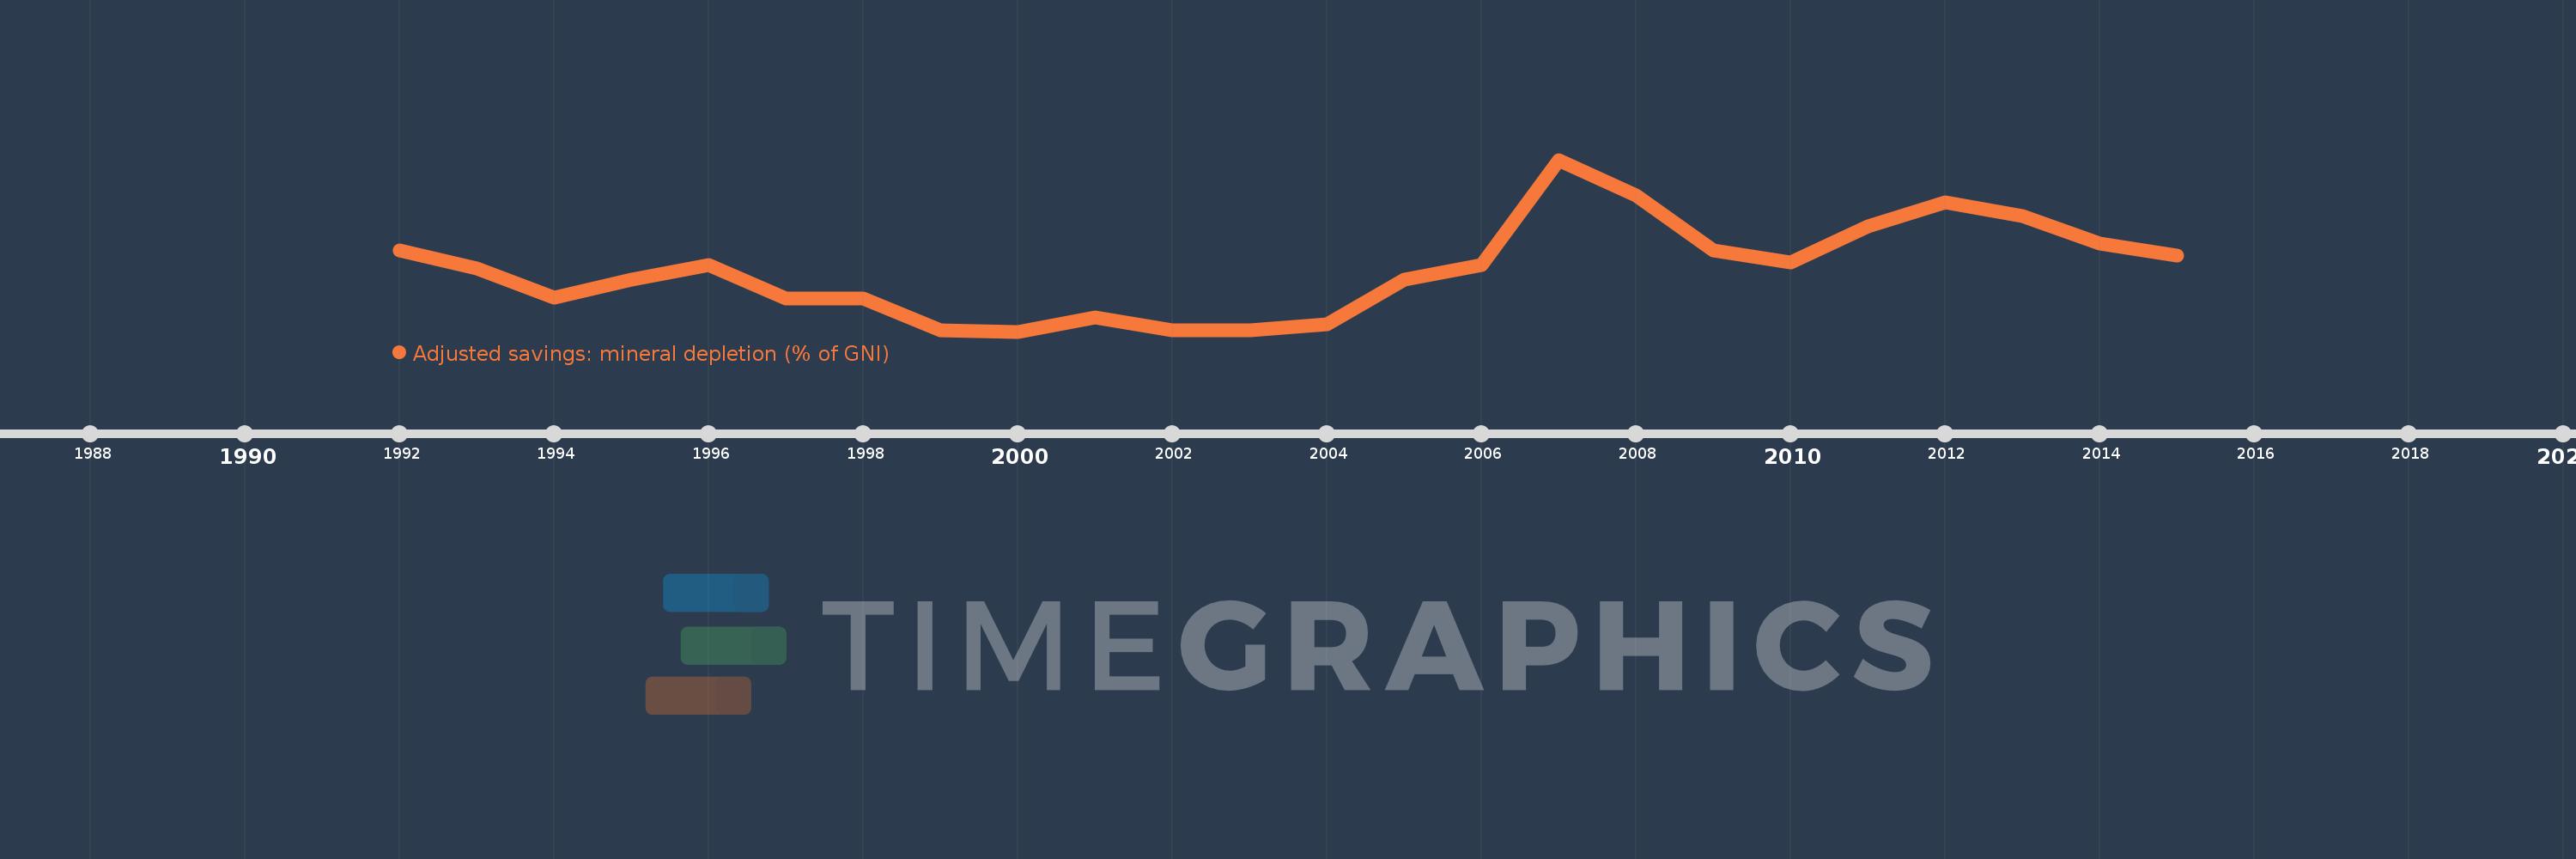
This timeline shows a graph from 1992 to 2015 of Poland. No data until 1991. Number of actual observations by date: 24.
Source name:
World Development Indicators
Source organization:
World Bank staff estimates based on sources and methods in World Bank's "The Changing Wealth of Nations: Measuring Sustainable Development in the New Millennium" (2011).
Categories, topics:
Economy & Growth, Energy & Mining, Environment
Last updated:
apr 23, 2017
Indicators value changes by year
Meaning:
0.168
Minimum:
0.035
jan 1, 2000
Maximum:
0.408
jan 1, 2007
At the date of observation
Value
Absolute change
Change from the previous value
jan 1, 1992
0.211
+0.211
0.0%
jan 1, 1993
0.173
-0.038
-18.03%
jan 1, 1994
0.108
-0.065
-37.66%
jan 1, 1995
0.147
+0.039
36.39%
jan 1, 1996
0.179
+0.032
21.58%
jan 1, 1997
0.106
-0.073
-40.76%
jan 1, 1998
0.106
+0.0
0.27%
jan 1, 1999
0.038
-0.068
-64.23%
jan 1, 2000
0.035
-0.003
-7.09%
jan 1, 2001
0.066
+0.03
86.14%
jan 1, 2002
0.037
-0.029
-43.75%
jan 1, 2003
0.037
+0.0
1.27%
jan 1, 2004
0.05
+0.012
33.03%
jan 1, 2005
0.148
+0.099
198.49%
jan 1, 2006
0.179
+0.03
20.33%
jan 1, 2007
0.408
+0.229
128.22%
jan 1, 2008
0.331
-0.077
-18.83%
jan 1, 2009
0.211
-0.12
-36.35%
jan 1, 2010
0.185
-0.026
-12.16%
jan 1, 2011
0.263
+0.078
41.95%
jan 1, 2012
0.315
+0.052
19.86%
jan 1, 2013
0.285
-0.03
-9.57%
jan 1, 2014
0.227
-0.057
-20.1%
jan 1, 2015
0.2
-0.028
-12.23%
Ranking of countries by current statistics by years