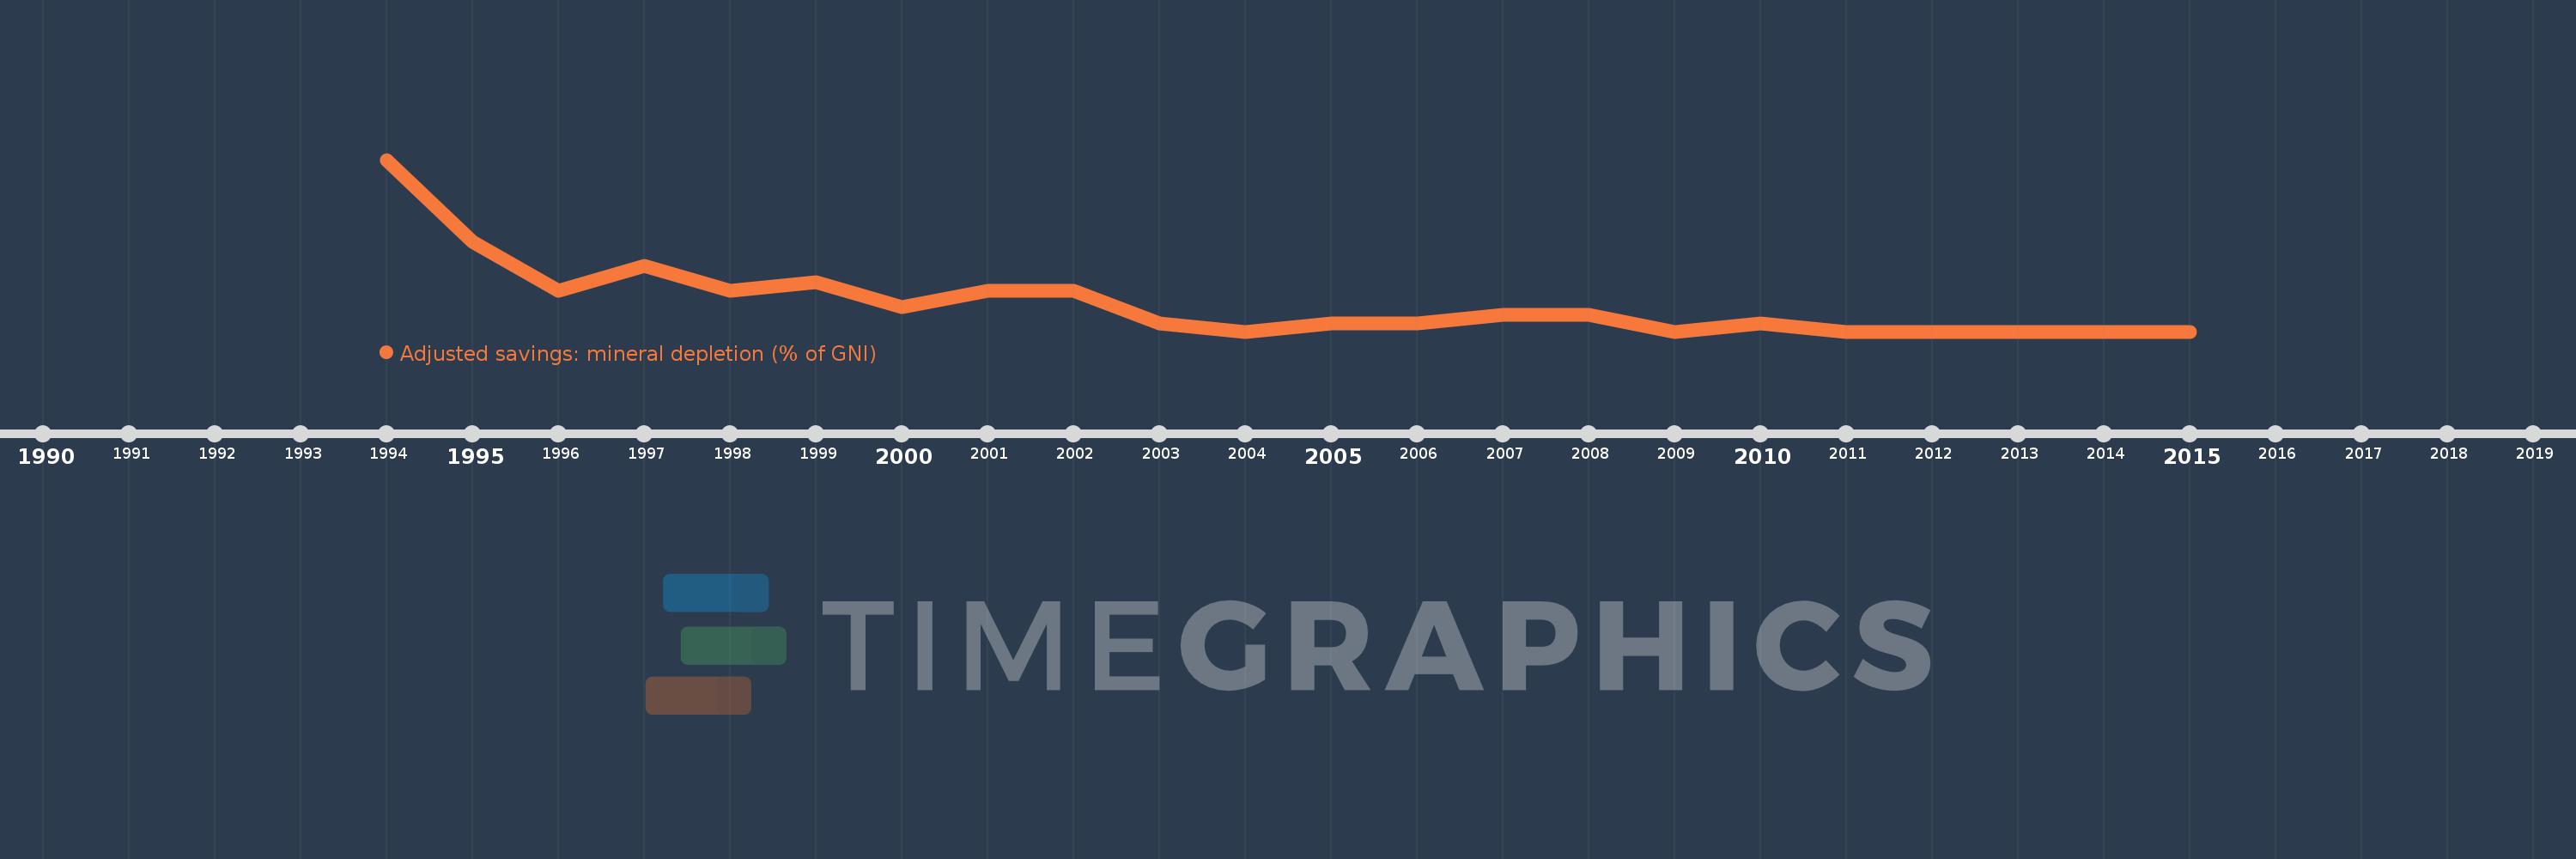
This timeline shows a graph from 1994 to 2015 of Hungary. No data until 1993. Number of actual observations by date: 22.
Source name:
World Development Indicators
Source organization:
World Bank staff estimates based on sources and methods in World Bank's "The Changing Wealth of Nations: Measuring Sustainable Development in the New Millennium" (2011).
Categories, topics:
Economy & Growth, Energy & Mining, Environment
Last updated:
apr 23, 2017
Indicators value changes by year
Meaning:
0.004
Minimum:
0.0
jan 1, 2004
Maximum:
0.021
jan 1, 1994
At the date of observation
Value
Absolute change
Change from the previous value
jan 1, 1994
0.021
+0.021
0.0%
jan 1, 1995
0.011
-0.011
-49.47%
jan 1, 1996
0.005
-0.006
-58.16%
jan 1, 1997
0.008
+0.004
84.87%
jan 1, 1998
0.005
-0.004
-43.61%
jan 1, 1999
0.006
+0.001
16.66%
jan 1, 2000
0.003
-0.002
-44.91%
jan 1, 2001
0.005
+0.002
57.94%
jan 1, 2002
0.005
0.0
-3.42%
jan 1, 2003
0.001
-0.003
-72.88%
jan 1, 2004
0.0
-0.001
-82.6%
jan 1, 2005
0.001
+0.001
350.21%
jan 1, 2006
0.001
+0.0
7.76%
jan 1, 2007
0.002
+0.001
50.08%
jan 1, 2008
0.002
+0.0
5.44%
jan 1, 2009
0.0
-0.001
-79.43%
jan 1, 2010
0.001
+0.0
58.94%
jan 1, 2011
0.0
0.0
-21.77%
jan 1, 2012
0.0
+0.0
4.64%
jan 1, 2013
0.0
0.0
-36.08%
jan 1, 2014
0.0
0.0
-14.17%
jan 1, 2015
0.0
+0.0
39.58%
Ranking of countries by current statistics by years